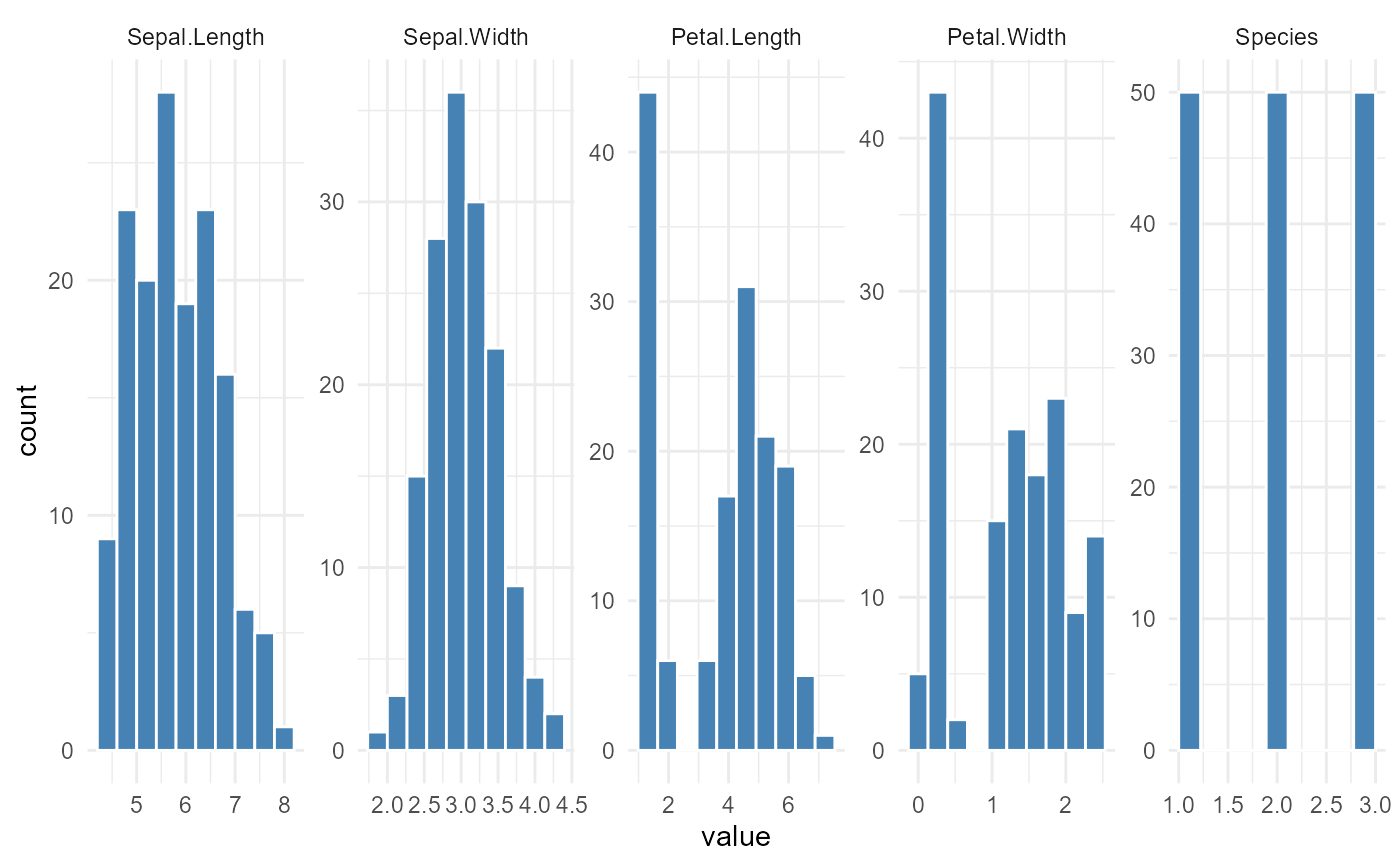
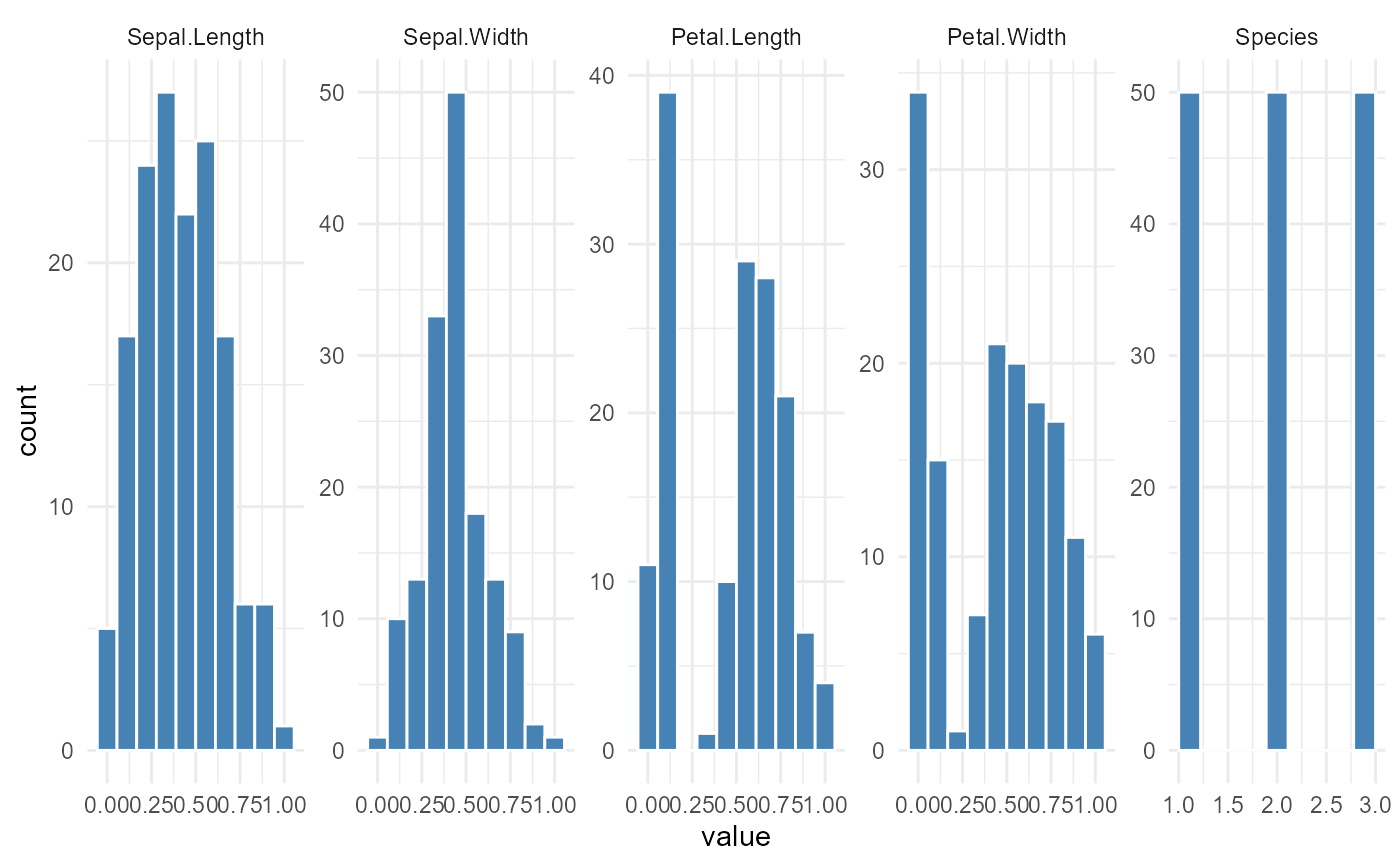
This function expects a data.frame/tibble and will return a faceted histogram.
Usage
hai_histogram_facet_plot(
  .data,
  .bins = 10,
  .scale_data = FALSE,
  .ncol = 5,
  .fct_reorder = FALSE,
  .fct_rev = FALSE,
  .fill = "steelblue",
  .color = "white",
  .scale = "free",
  .interactive = FALSE
)
Arguments
- .data
The data you want to pass to the function.
- .bins
The number of bins for the histograms.
- .scale_data
This is a boolean set to FALSE. TRUE will use
hai_scale_zero_one_vec()to[0, 1]scale the data.- .ncol
The number of columns for the facet_warp argument.
- .fct_reorder
Should the factor column be reordered? TRUE/FALSE, default of FALSE
- .fct_rev
Should the factor column be reversed? TRUE/FALSE, default of FALSE
- .fill
Default is
steelblue- .color
Default is 'white'
- .scale
Default is 'free'
- .interactive
Default is FALSE, TRUE will produce a
plotlyplot.