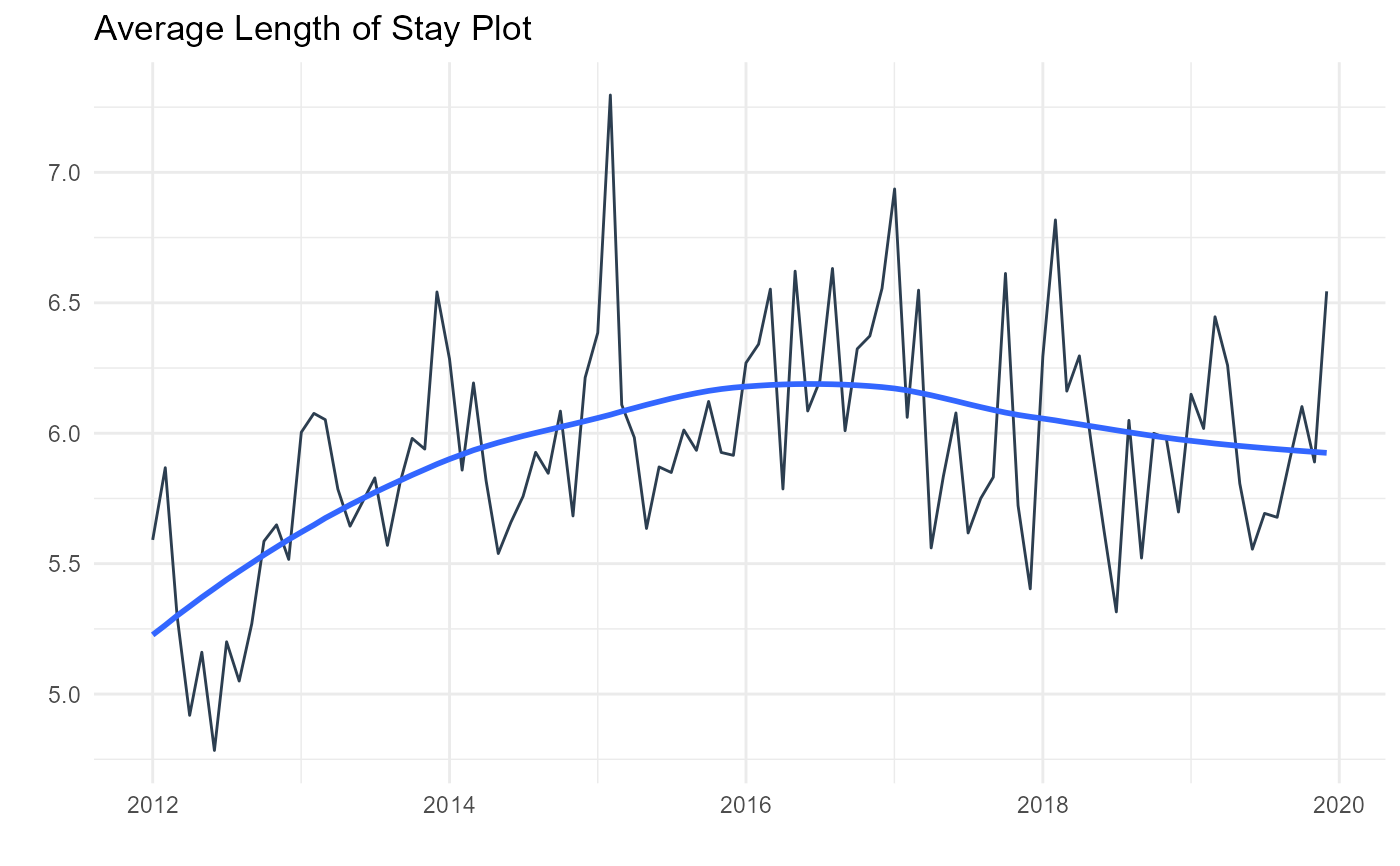
Plot ALOS - Average Length of Stay
Arguments
- .data
The time series data you need to pass
- .date_col
The date column
- .value_col
The value column
- .by_grouping
How you want the data summarized - "sec", "min", "hour", "day", "week", "month", "quarter" or "year"
- .interactive
TRUE or FALSE. TRUE returns a
plotlyplot and FALSE returns a staticggplot2plot
Details
Expects a tibble with a date time column and a value column
Uses
timetkfor underlying sumarization and plotIf .by_grouping is missing it will default to "day"
A static ggplot2 object is return if the .interactive function is FALSE otherwise a
plotlyplot is returned.
See also
Other Plotting Functions:
diverging_bar_plt(),
diverging_lollipop_plt(),
gartner_magic_chart_plt(),
los_ra_index_plt(),
ts_median_excess_plt(),
ts_plt(),
ts_readmit_rate_plt()
Examples
library(healthyR)
library(healthyR.data)
library(timetk)
library(dplyr)
library(purrr)

# Make A Series of Dates ----
data_tbl <- healthyR_data

df_tbl <- data_tbl %>%
    filter(ip_op_flag == "I") %>%
    select(visit_end_date_time, length_of_stay) %>%
    summarise_by_time(
        .date_var = visit_end_date_time
        , .by     = "day"
        , visits  = mean(length_of_stay, na.rm = TRUE)
    ) %>%
    filter_by_time(
        .date_var     = visit_end_date_time
        , .start_date = "2012"
        , .end_date   = "2019"
    ) %>%
    set_names("Date","Values")

ts_alos_plt(
  .data = df_tbl
  , .date_col = Date
  , .value_col = Values
  , .by = "month"
  , .interactive = FALSE
)
#> Ignoring unknown labels:
#> • colour : "Legend"