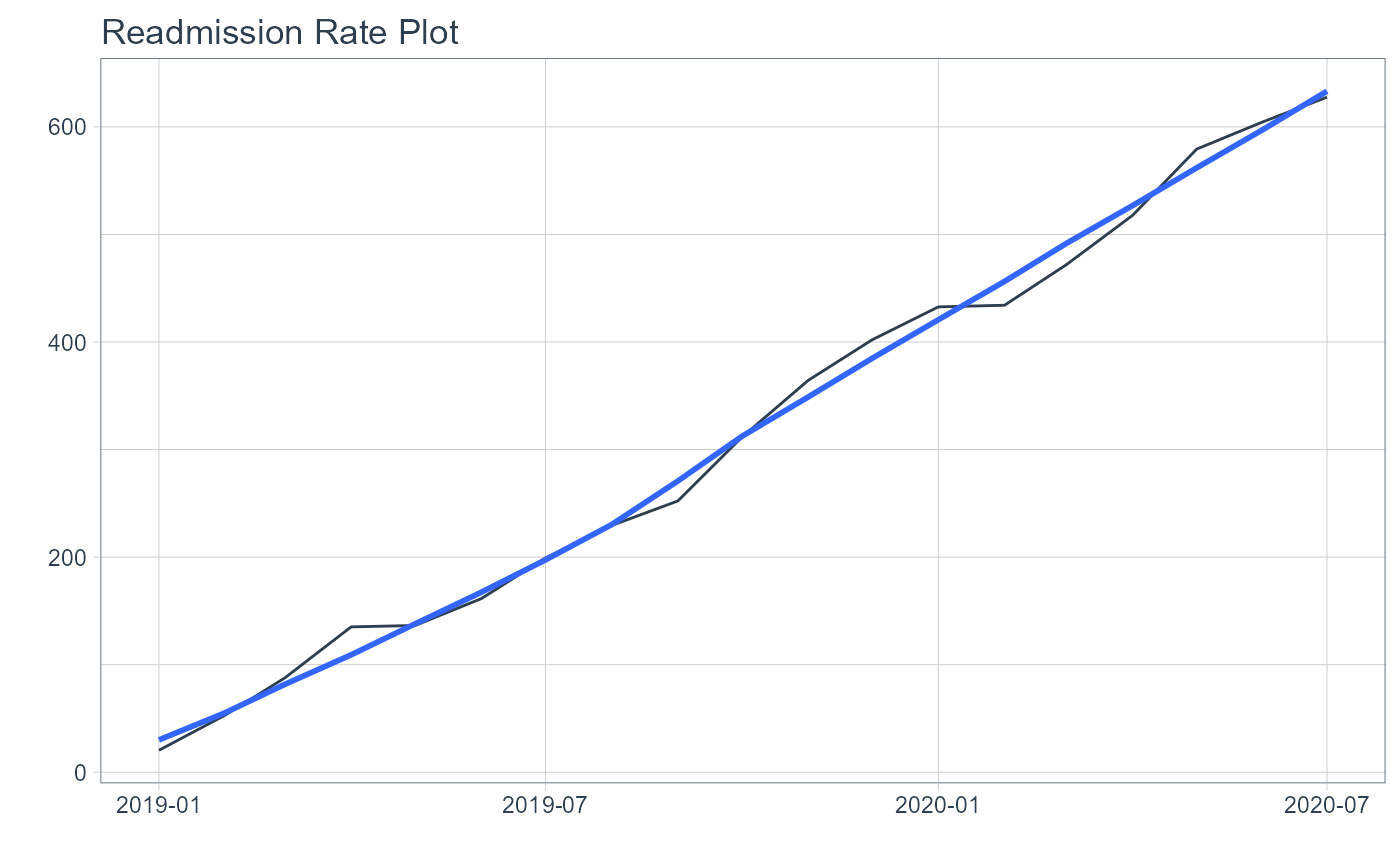
Plot Readmit Rate
Details
Expects a tibble with a date time column and a value column
Uses
timetkfor underlying sumarization and plotIf .by_grouping is missing it will default to "day"
See also
Other Plotting Functions:
diverging_bar_plt(),
diverging_lollipop_plt(),
gartner_magic_chart_plt(),
los_ra_index_plt(),
ts_alos_plt(),
ts_median_excess_plt(),
ts_plt()
Examples
set.seed(123)

suppressPackageStartupMessages(library(timetk))
suppressPackageStartupMessages(library(purrr))
suppressPackageStartupMessages(library(dplyr))

ts_tbl <- tk_make_timeseries(
  start = "2019-01-01"
  , by = "day"
  , length_out = "1 year 6 months"
)
values <- arima.sim(
  model = list(
    order = c(0, 1, 0))
    , n = 547
    , mean = 1
    , sd = 5
)

df_tbl <- tibble(
  x = ts_tbl
  , y = values
  ) %>%
  set_names("Date","Values")

ts_readmit_rate_plt(
  .data = df_tbl
  , .date_col = Date
  , .value_col = Values
  , .by = "month"
  , .interactive = FALSE
)
#> Ignoring unknown labels:
#> • colour : "Legend"