Exploring Rolling Correlation with the rollapply Function: A Powerful Tool for Analyzing Time-Series Data
rtip
timeseries
Author
Steven P. Sanderson II, MPH
Published
June 28, 2023
Introduction
In the world of data analysis, time-series data is a common sight. Whether it’s stock prices, weather patterns, or website traffic, understanding the relationship between variables over time is crucial. One valuable technique in this domain is calculating rolling correlation, which allows us to examine the evolving correlation between two variables as our data moves through time. In this blog post, we will delve into the rollapply function and its capabilities, exploring its applications through a series of practical examples. So, let’s get started!
Understanding Rolling Correlation
Before we jump into the technical details, let’s quickly recap what correlation means. In simple terms, correlation measures the strength and direction of the linear relationship between two variables. It ranges between -1 and 1, where -1 represents a perfect negative correlation, 1 represents a perfect positive correlation, and 0 represents no correlation.
Rolling correlation takes this concept further by calculating correlation values over a moving window of observations. By doing so, we can observe how the correlation between two variables changes over time, gaining insights into trends, seasonality, or other patterns in our data.
Introducing the rollapply Function
In R programming, the rollapply function, available in the zoo package, is a powerful tool for calculating rolling correlation. It enables us to apply a function, such as correlation, to a rolling window of our data. The general syntax for using rollapply is as follows:
rollapply(data, width, FUN, ...)
Here’s what each parameter represents: - data: The time-series data we want to analyze. - width: The size of the rolling window, indicating how many observations should be included in each correlation calculation. - FUN: The function we want to apply to each rolling window. In this case, we will use the cor function to calculate correlation. - ...: Additional arguments that can be passed to the correlation function or any other function used with rollapply.
Now, let’s dive into some practical examples to see the rollapply function in action.
Example
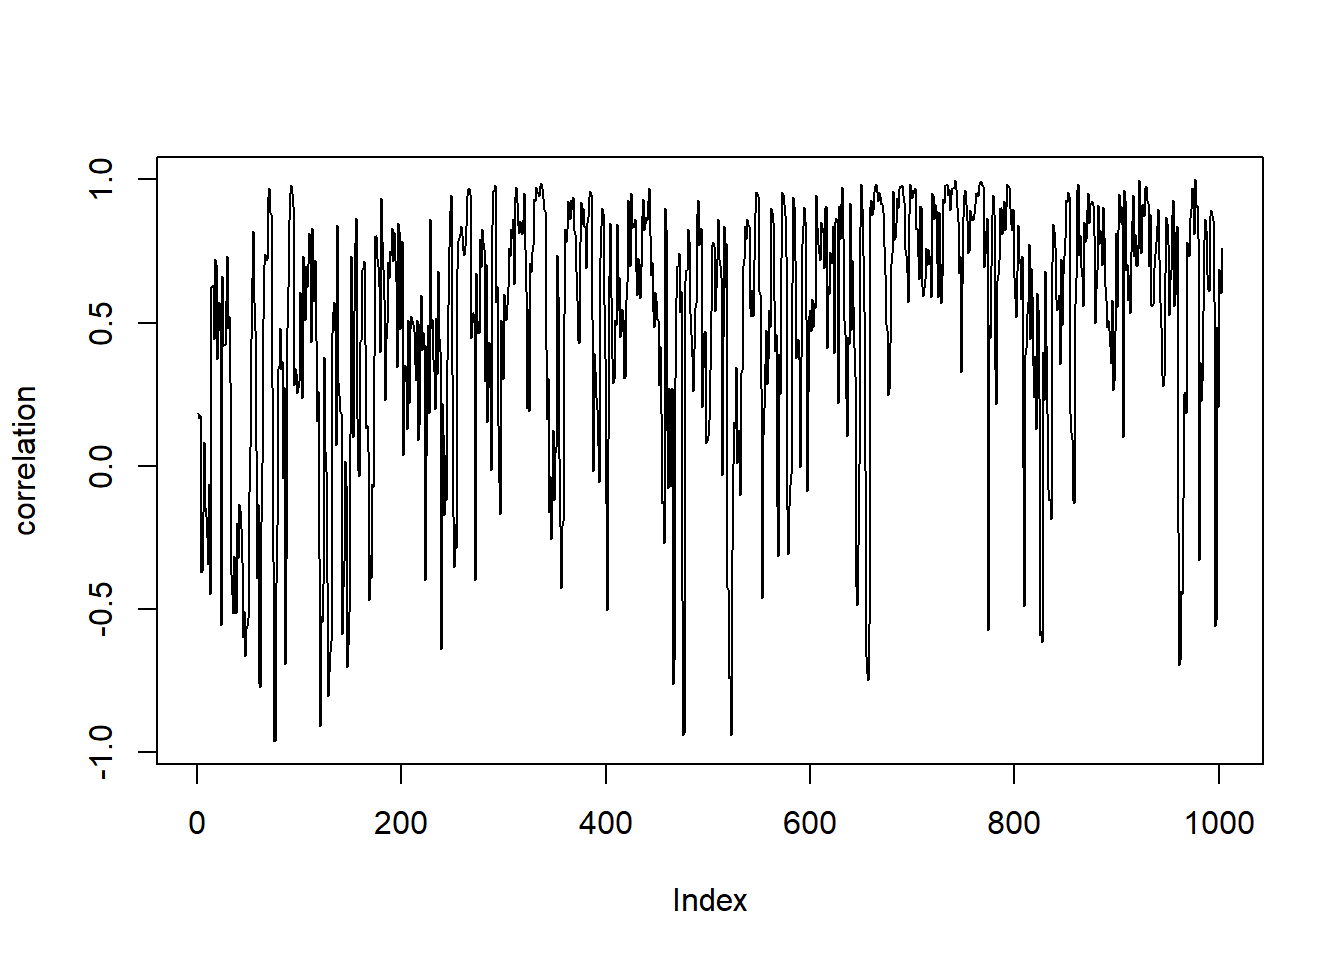
Imagine we have a dataset containing daily stock prices for two companies, A and B. Our goal is to explore the rolling correlation between the returns of these two stocks over a 30-day window.
In this example, we calculate the logarithmic returns of FB and AMZN using the diff function. Then, we apply the cor function to the rolling window of returns, with a width of 5. The by.column = FALSE parameter ensures that the correlation is computed across rows instead of columns, and the fill = NA parameter fills any incomplete windows with NA values.
Conclusion
In this blog post, we explored the concept of rolling correlation and its significance in analyzing time-series data. We learned how to harness the power of the rollapply function from the zoo package to calculate rolling correlation effortlessly. By utilizing rollapply, we can observe the dynamic nature of correlation, uncover trends, and gain valuable insights from our time-dependent datasets.
Remember, rolling correlation is just one of the many applications of the rollapply function. Its versatility empowers us to explore various other statistics, such as moving averages, standard deviations, and more. So, dive into the world of time-series analysis with rollapply and unlock the hidden patterns in your data!