


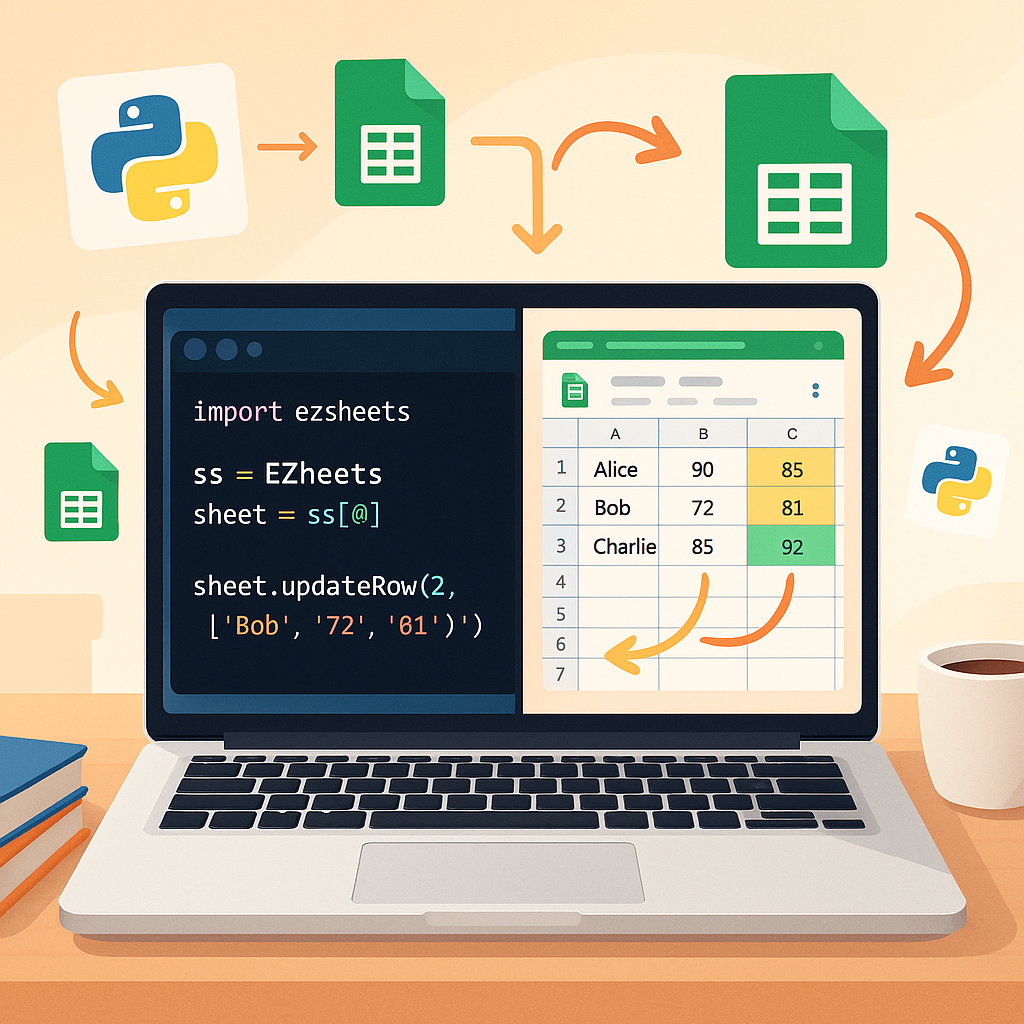
Working with CSV Files and JSON Data in Python
code
python


The Complete Guide to While Loops in R
code
rtip


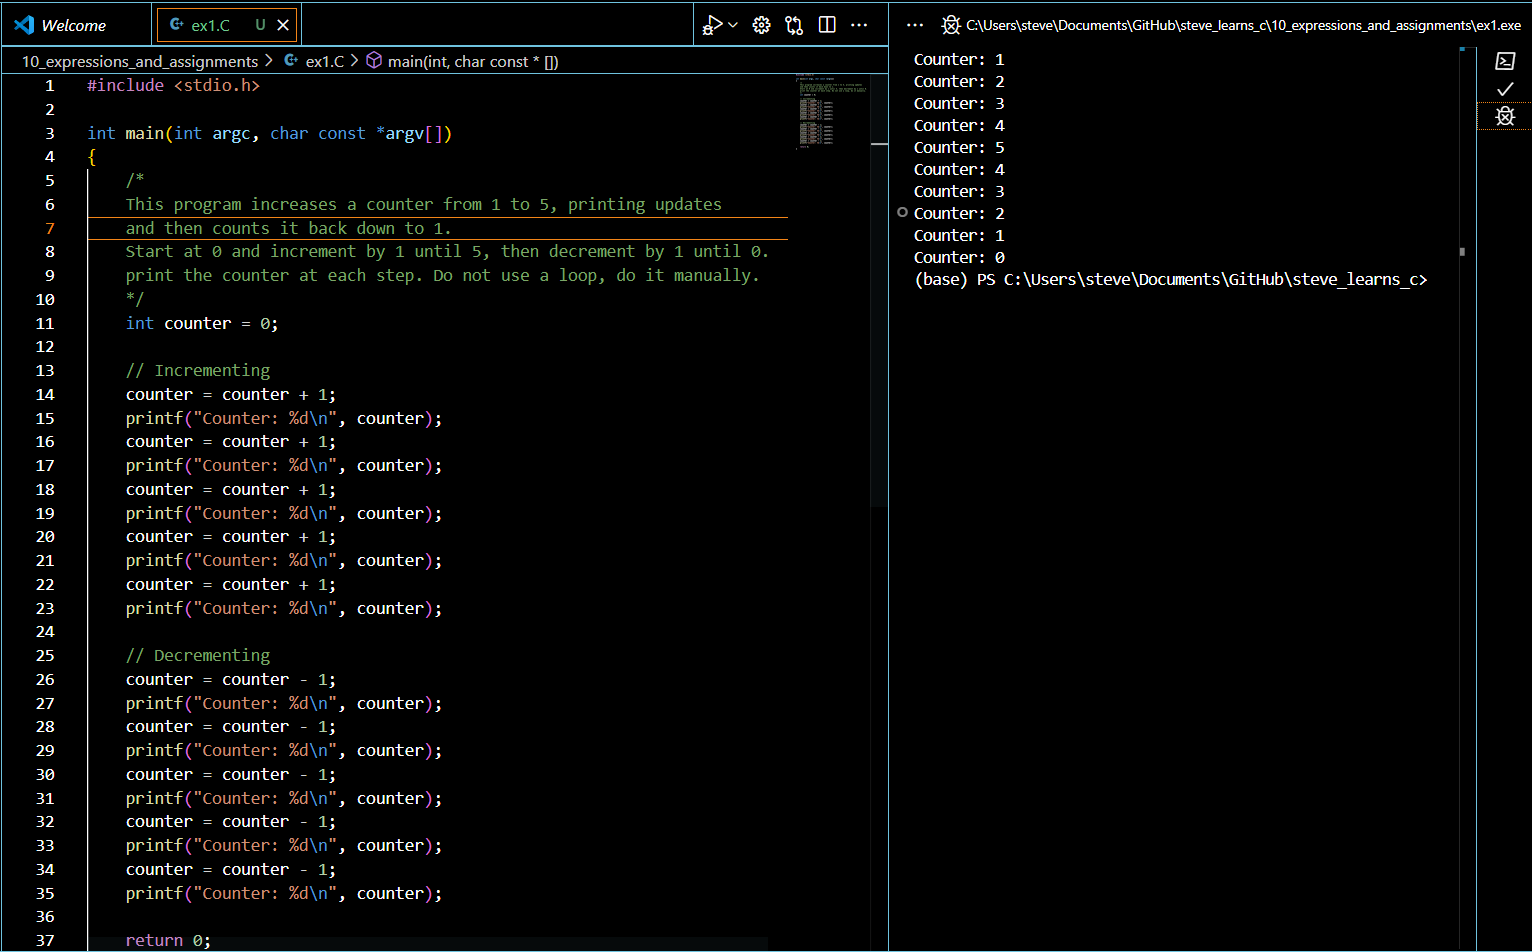
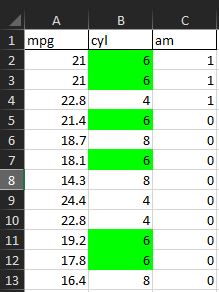
How to Select Row with Max Value in Specific Column in R: A Complete Guide
code
rtip
operations


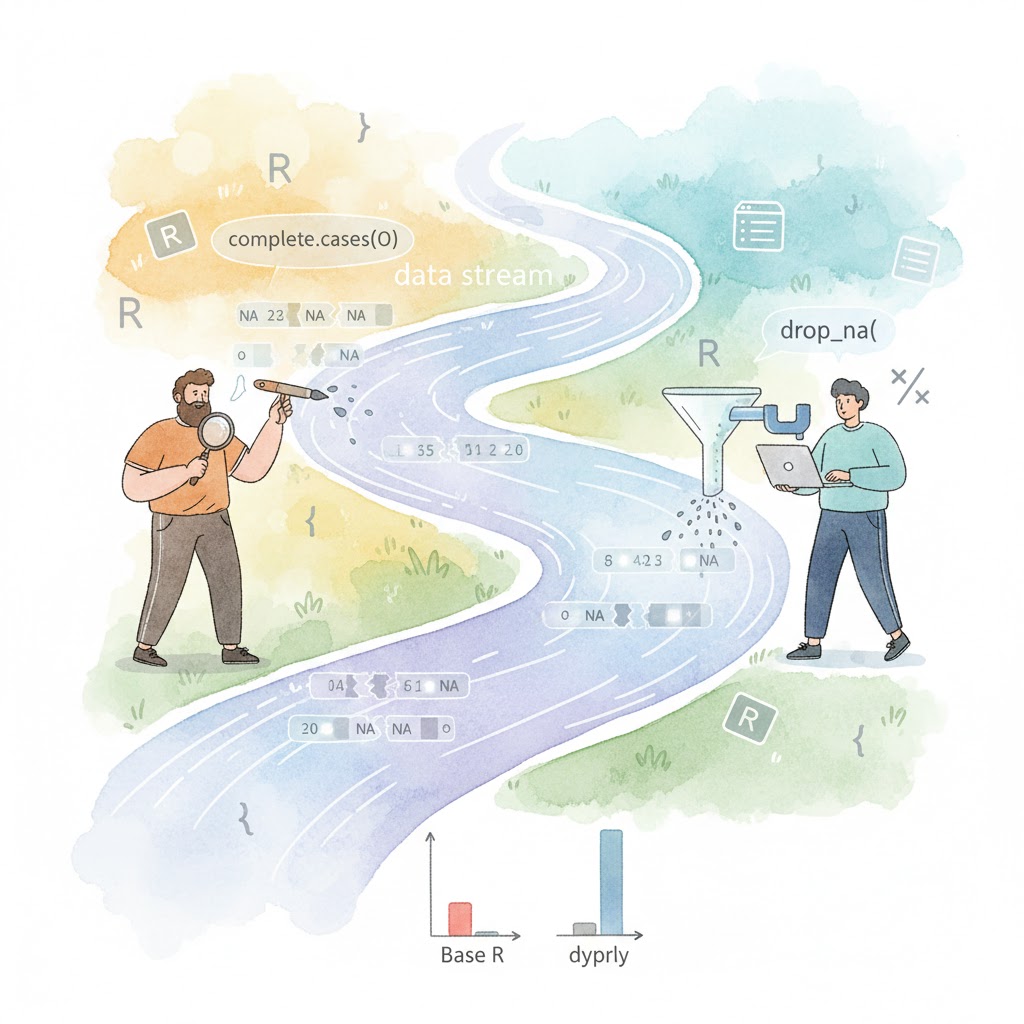
How to Replace Missing Values in R: A Comprehensive Guide
code
rtip
operations


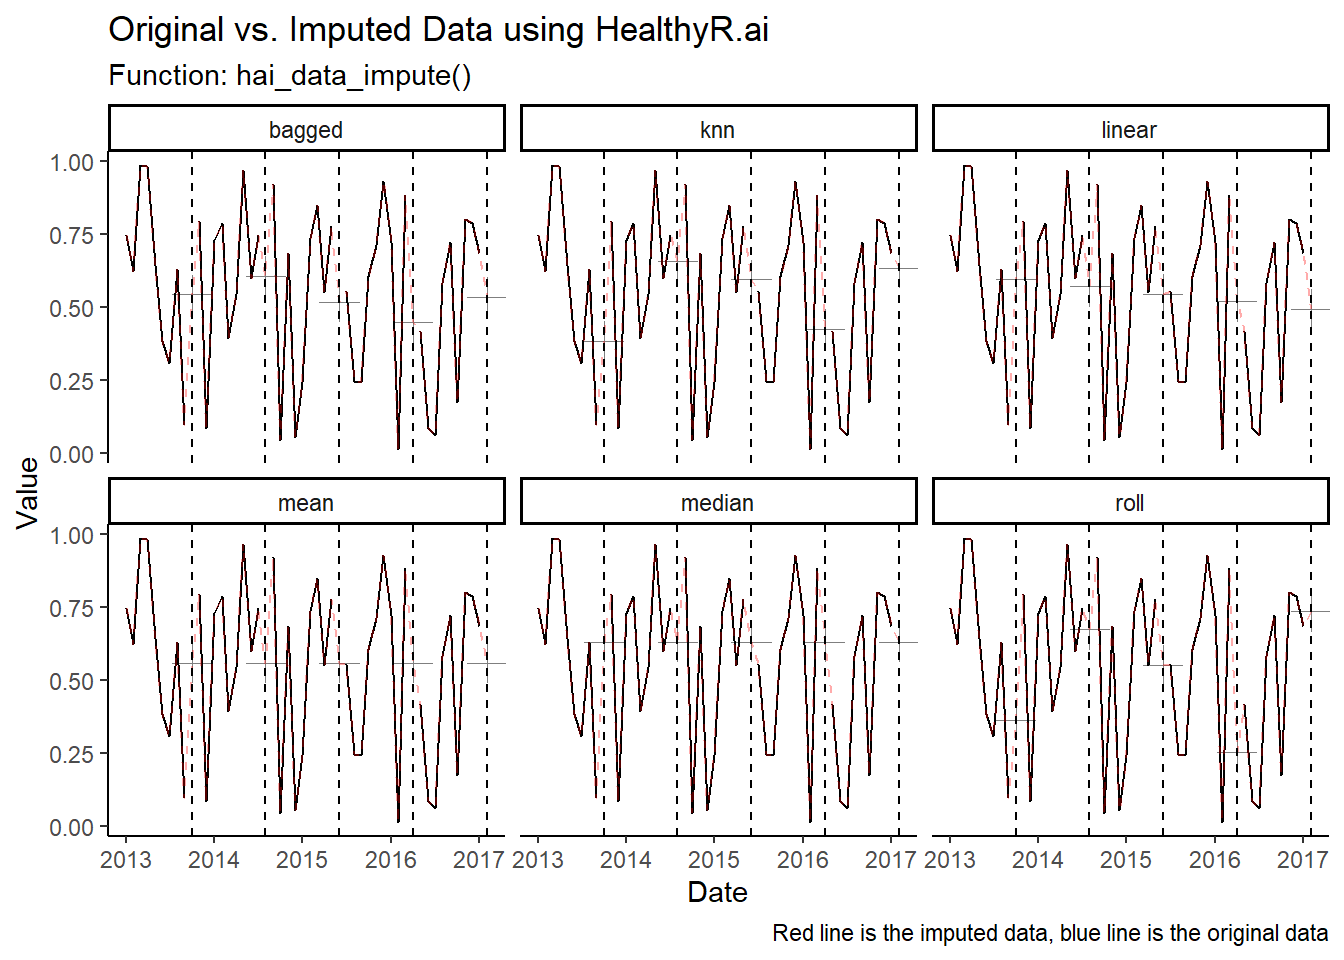
How to Interpolate Missing Values in R: A Step-by-Step Guide with Examples
code
rtip
operations

Deleting Multiple Columns in R: A Step-by-Step Guide for Data Frame Manipulation
code
rtip
operations

Mastering String Comparison in R: 3 Essential Examples and Bonus Tips
code
rtip
operations
strings
stringr
stringi


How to Subset a Data Frame in R: 4 Practical Methods with Examples
code
rtip
operations


How to Use NOT IN Operator in R: A Complete Guide with Examples
code
rtip
operations


How to Add Prefix to Column Names in Base R: A Comprehensive Guide for Beginners
code
rtip
operations


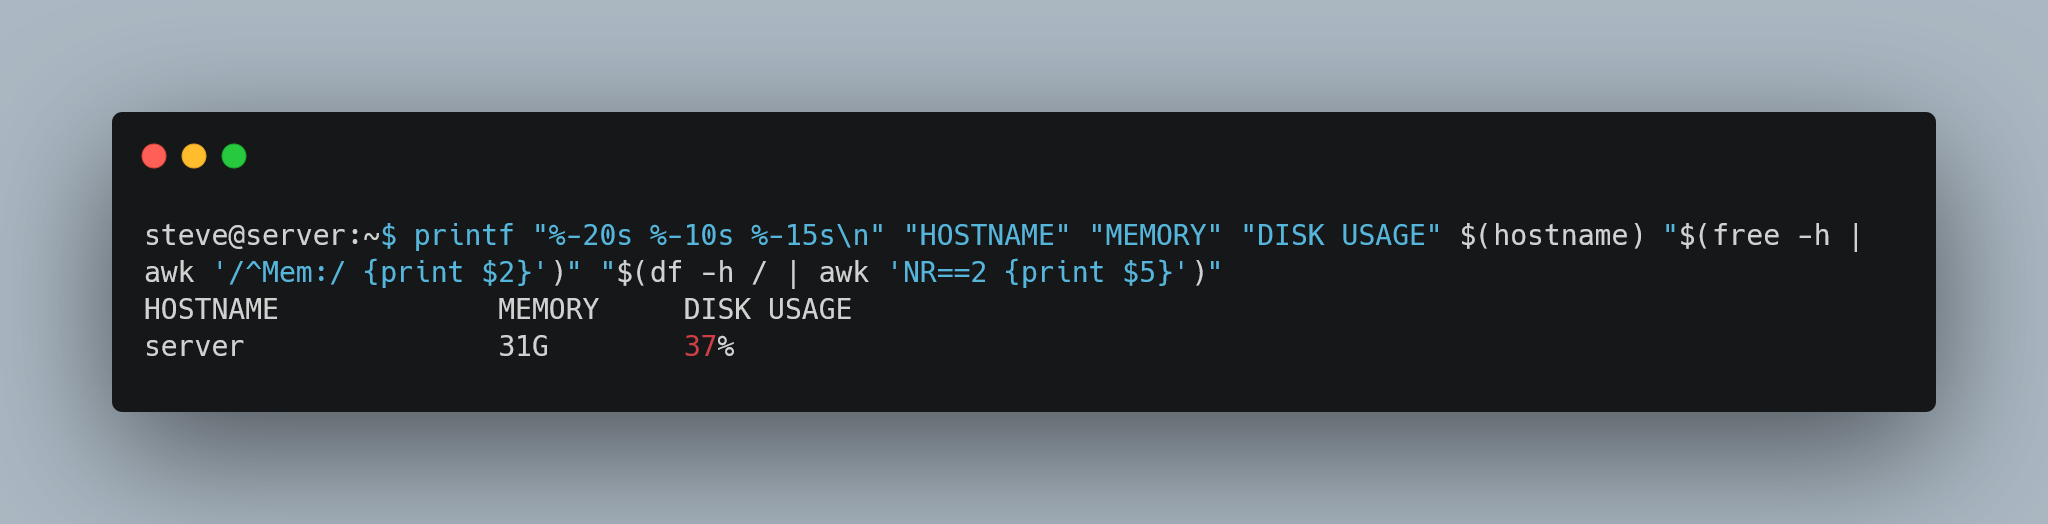
Redirection in Linux: A Beginner’s Guide
code
rtip
linux

How to Combine Two Data Frames in R with Different Columns Using Base R, dplyr, and data.table
code
rtip
operations
dplyr
datatable

How to Combine Two Columns into One in R With Examples in Base R and tidyr
code
rtip
operations
tidyr


How to Check if a String Contains Specific Characters in R: A Comprehensive Guide with Base R, string & stringi
code
rtip
strings
stringr
stringi
How to Split a Character String and Get the First Element in R
code
rtip
operations
strings
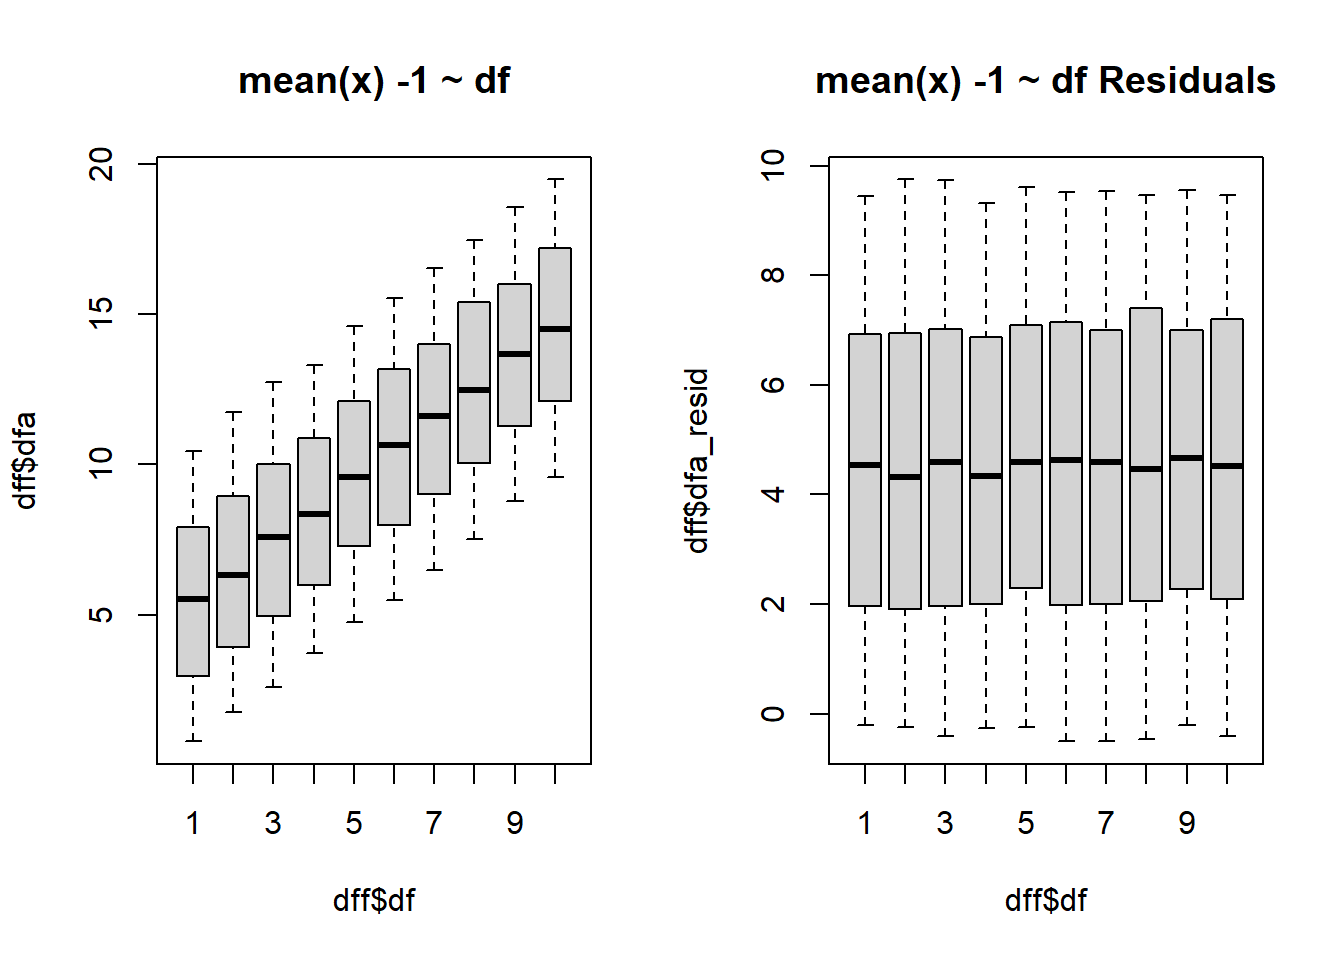
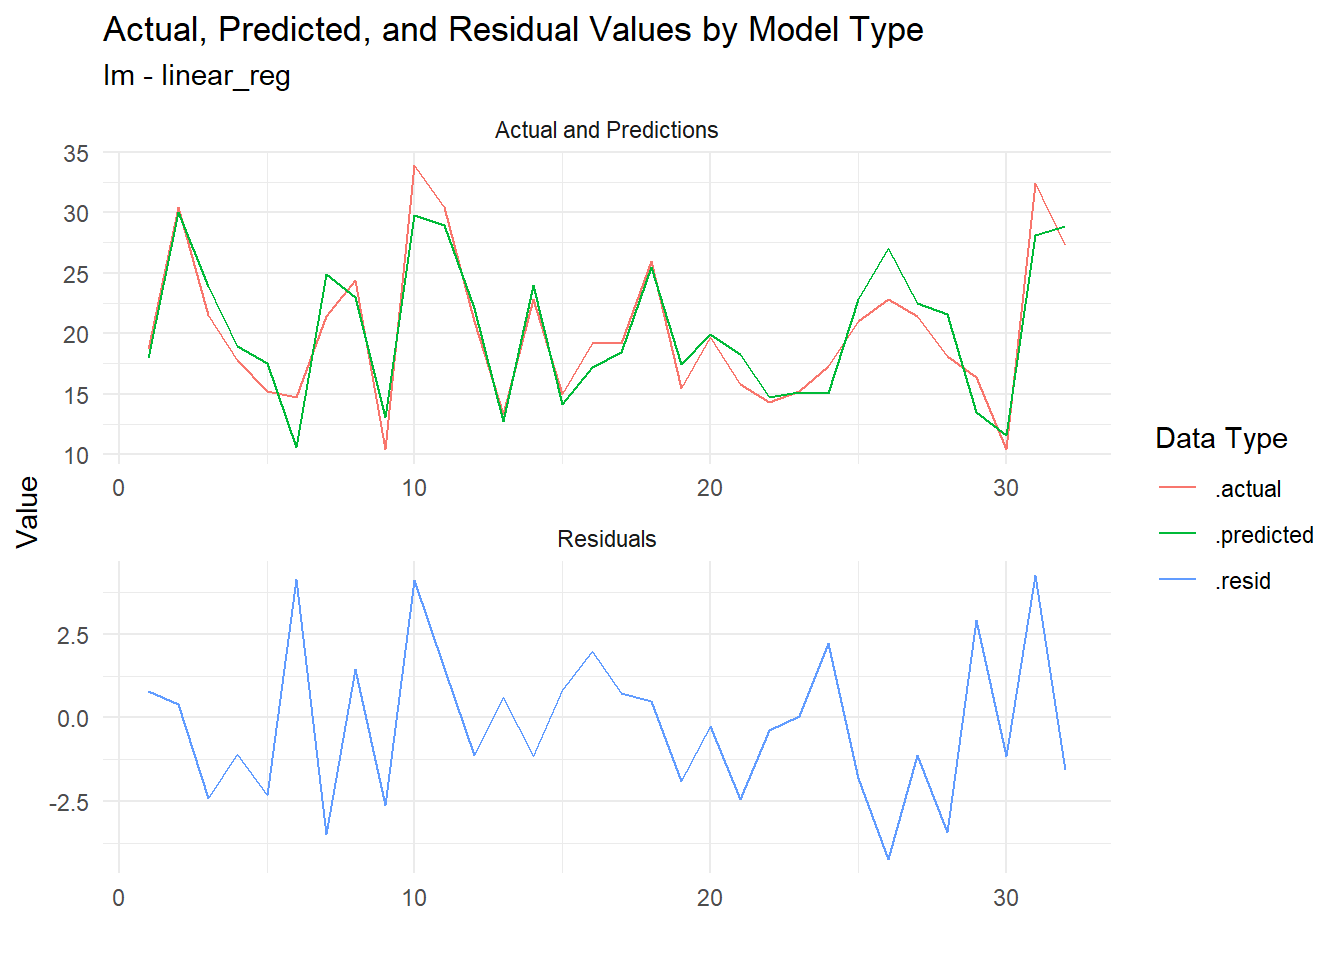
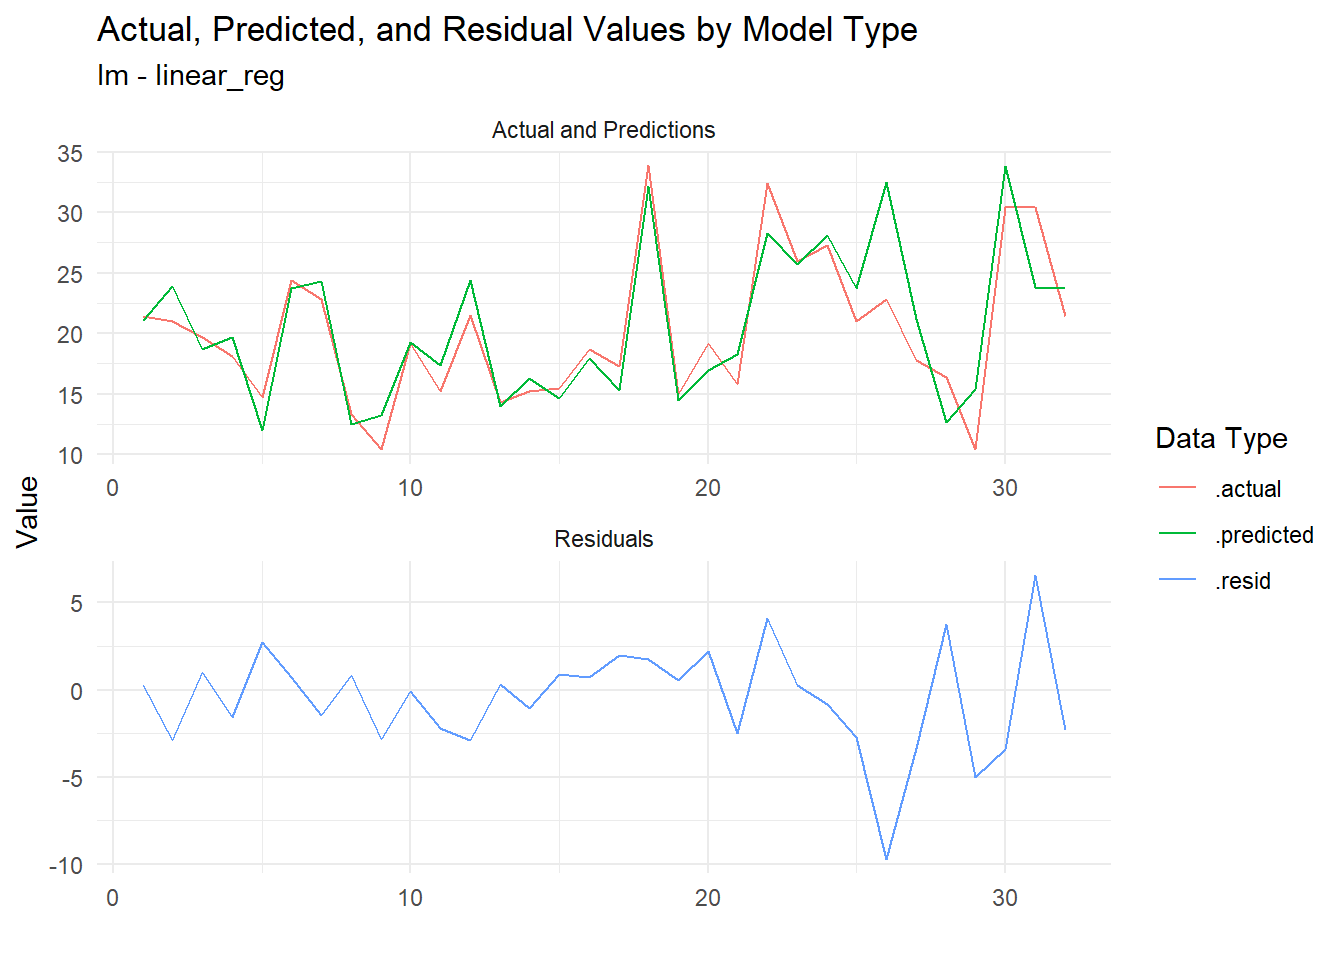
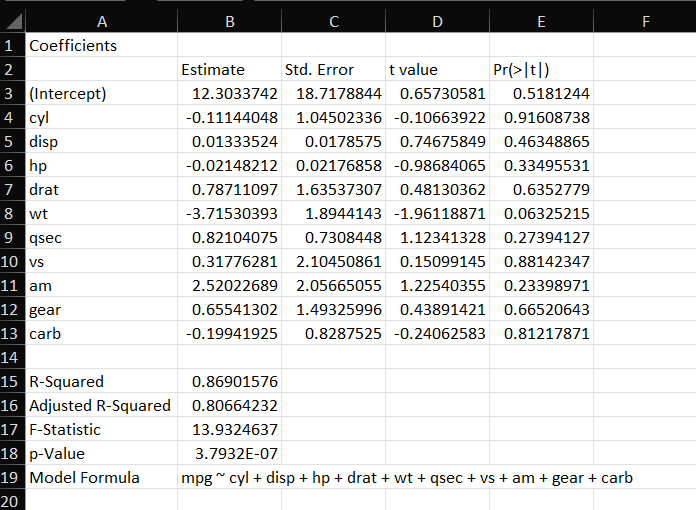
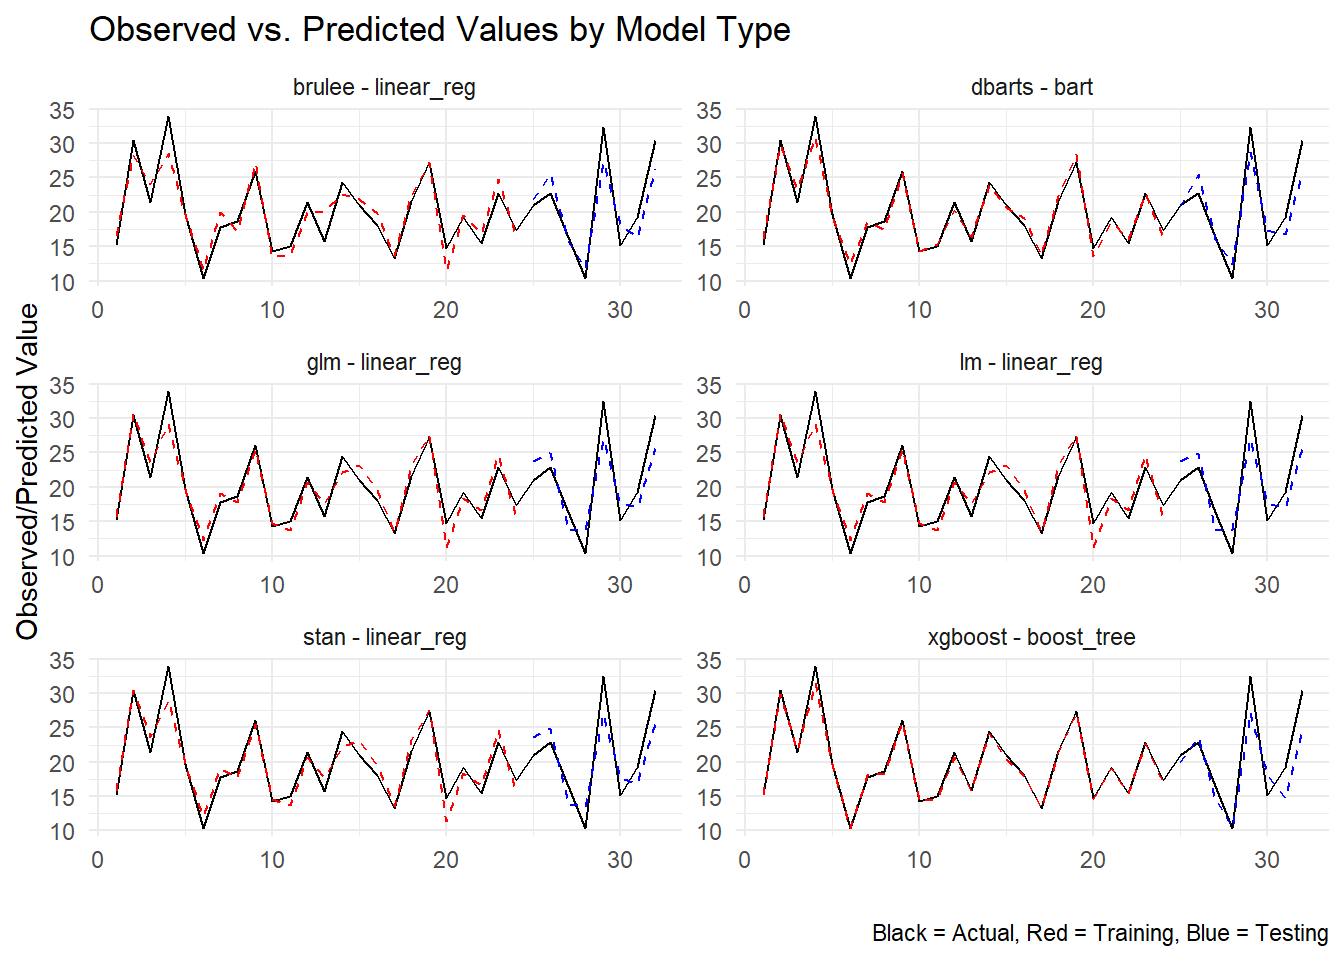
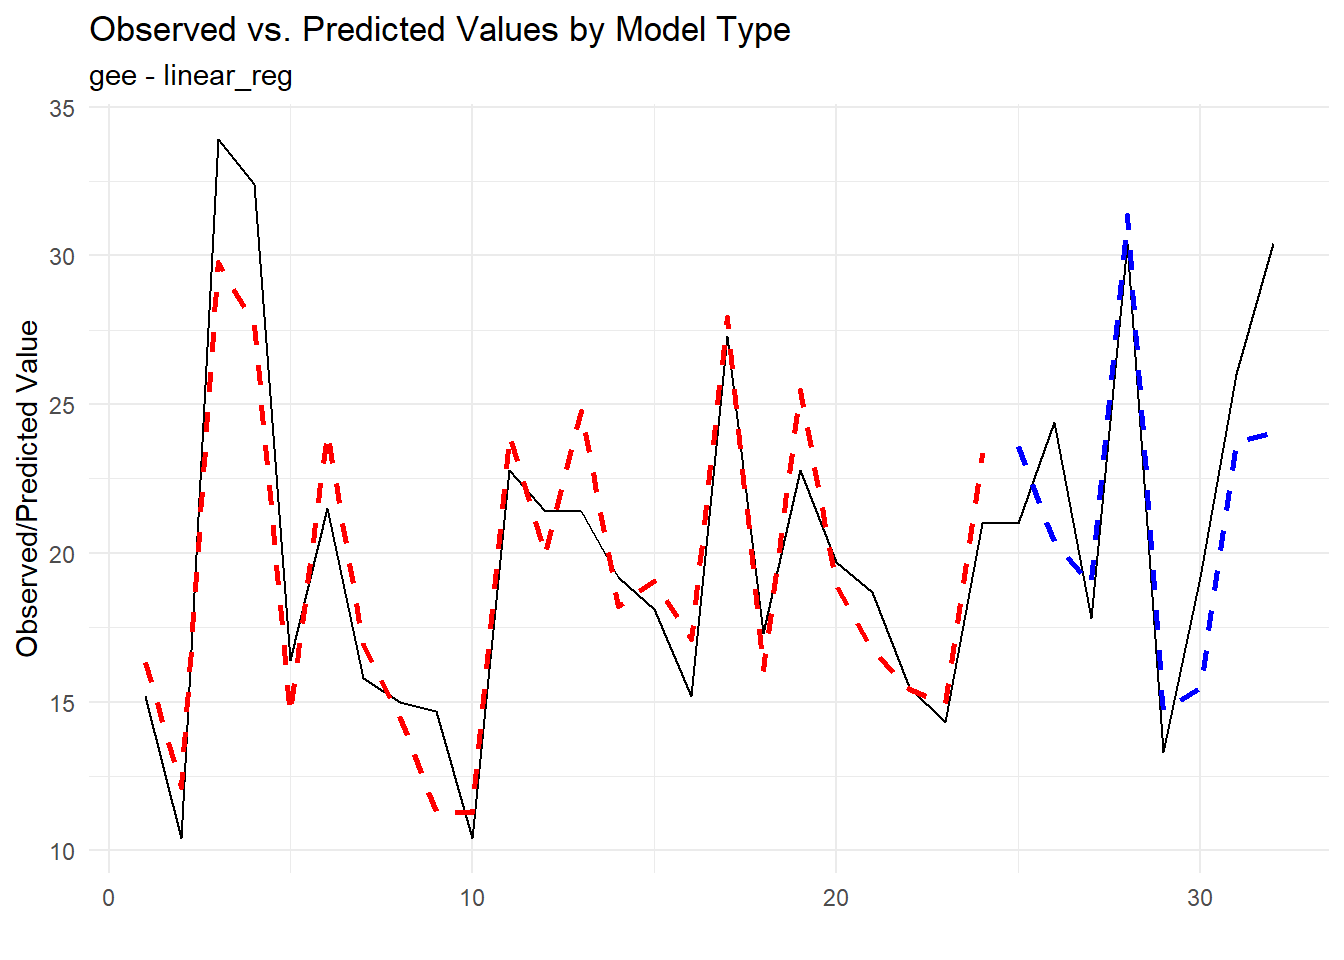
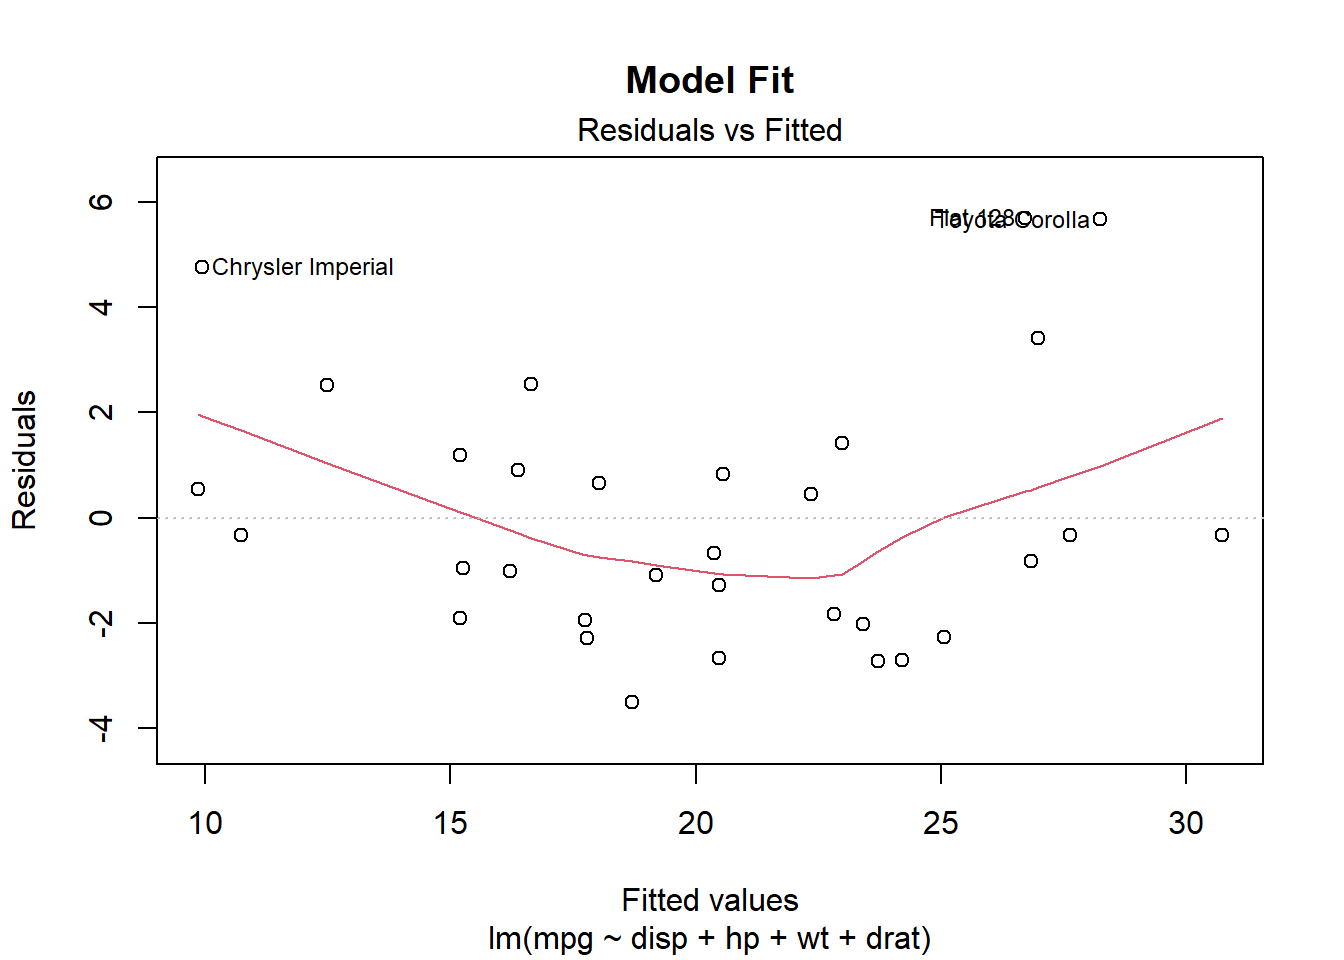
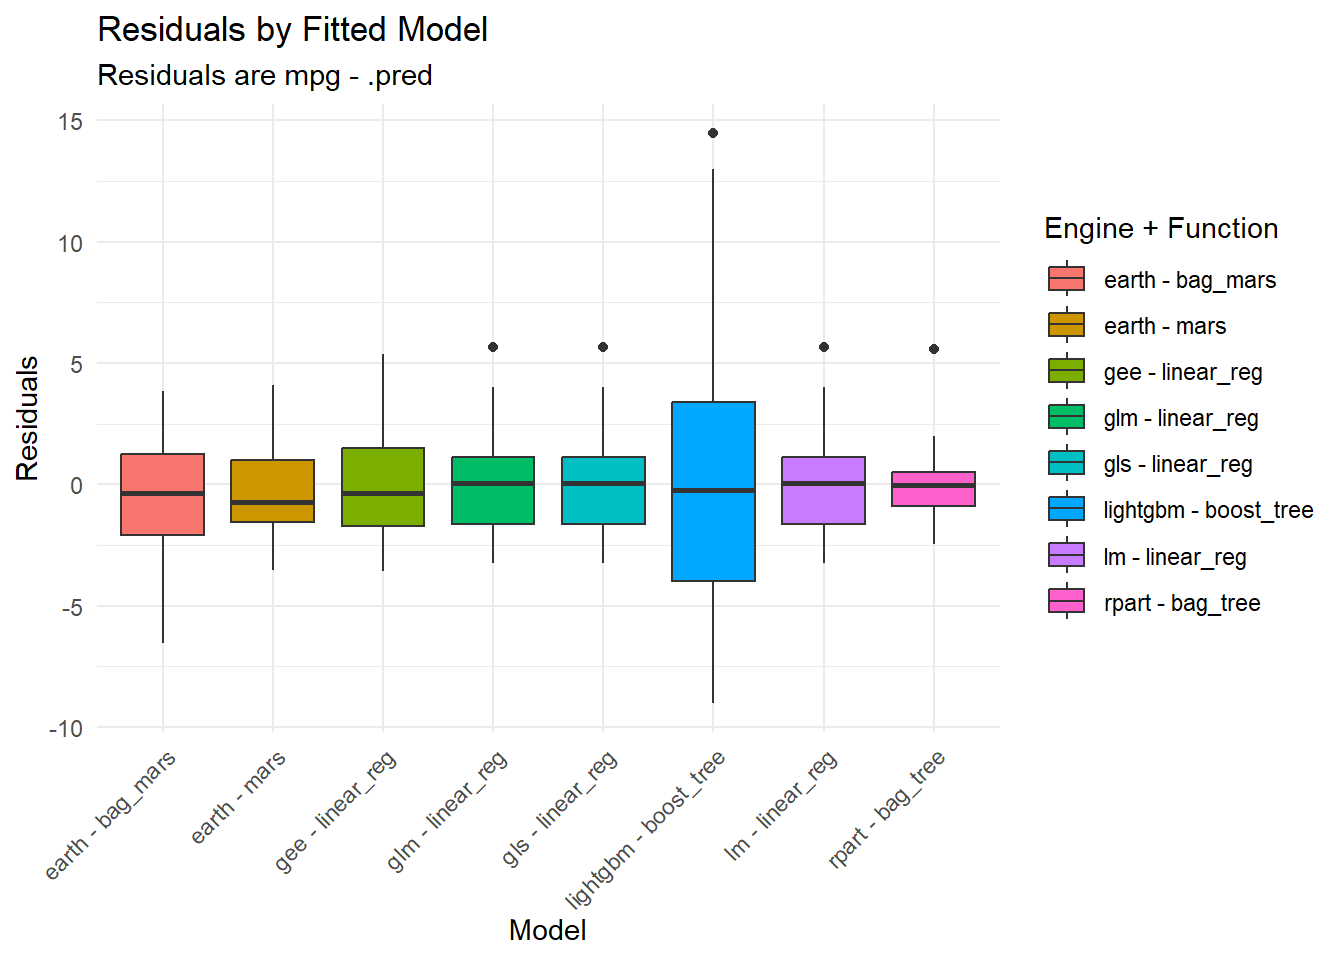
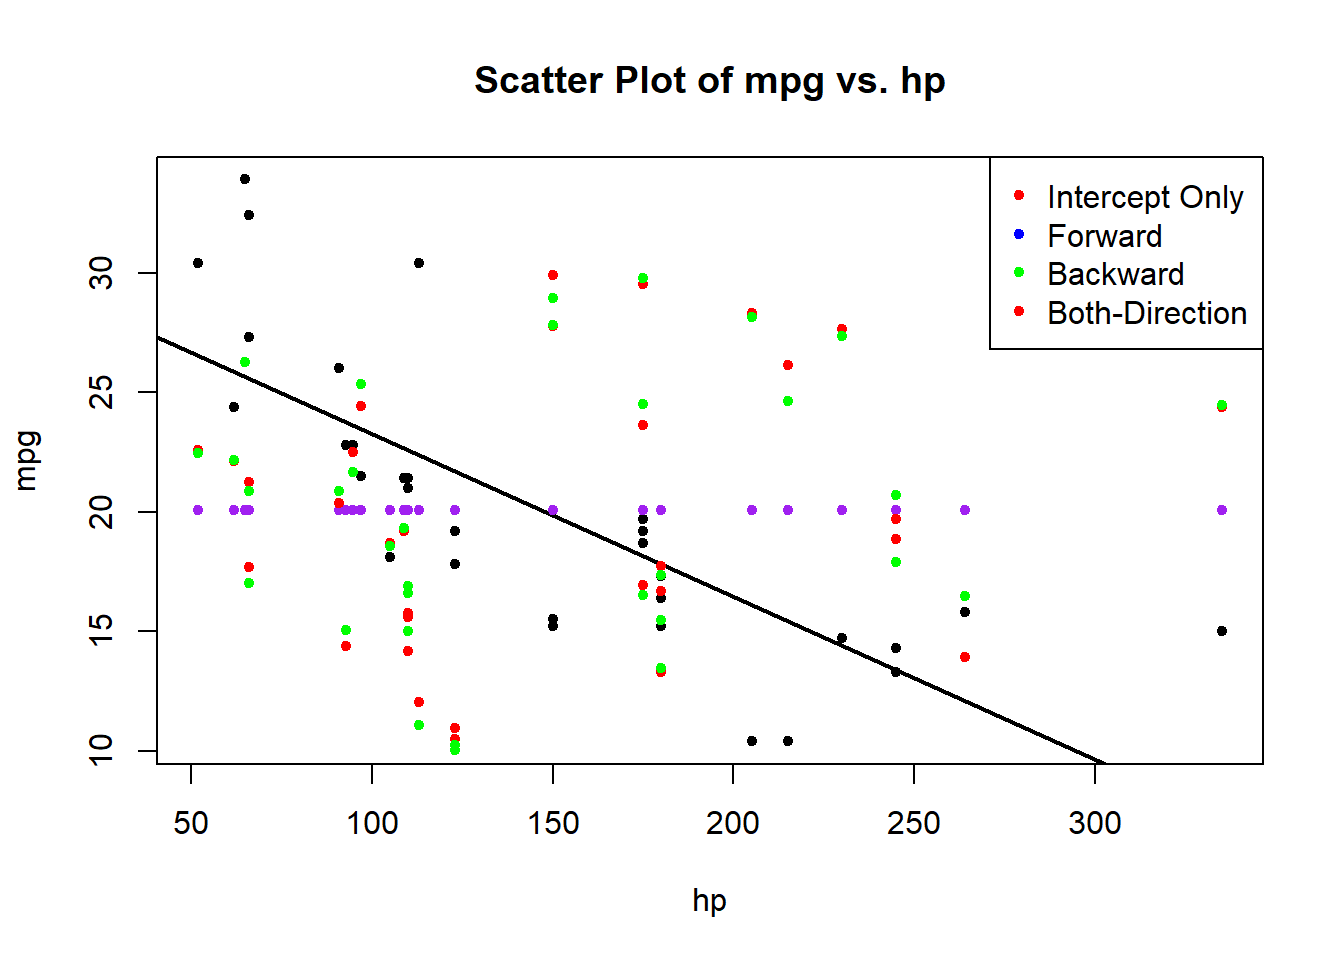
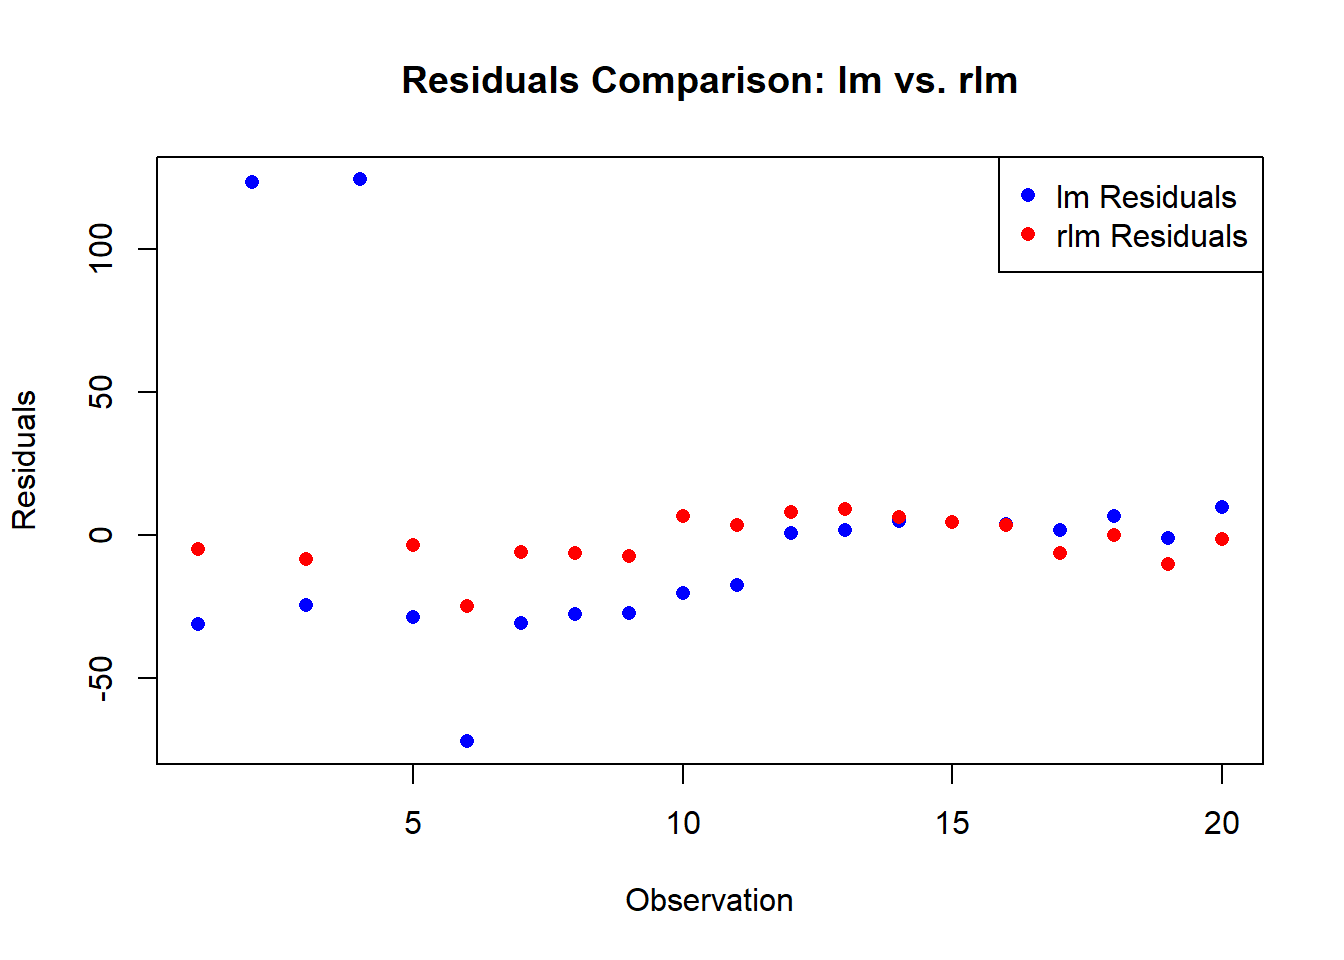
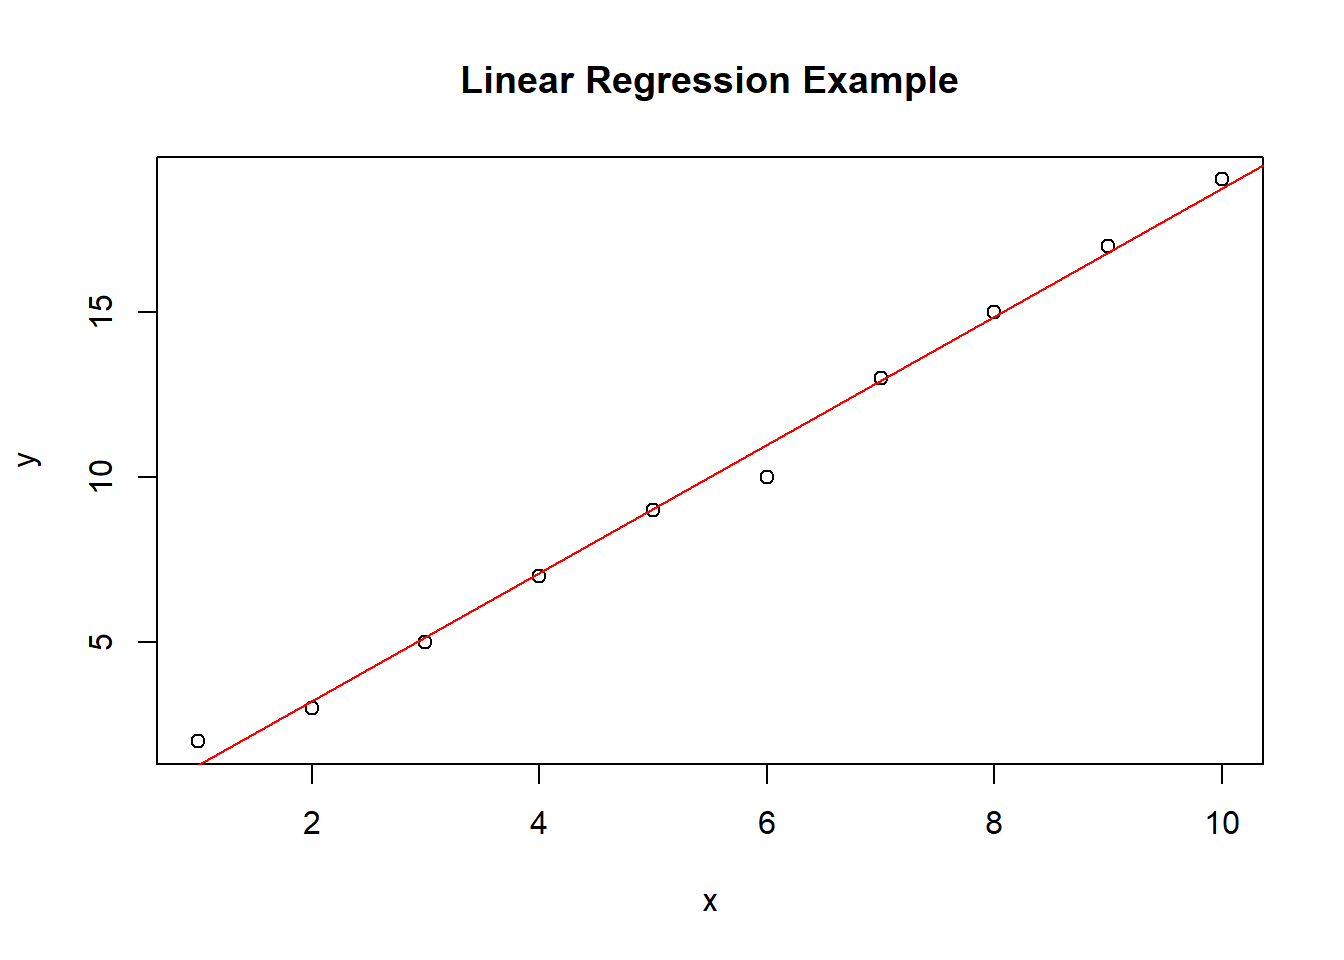
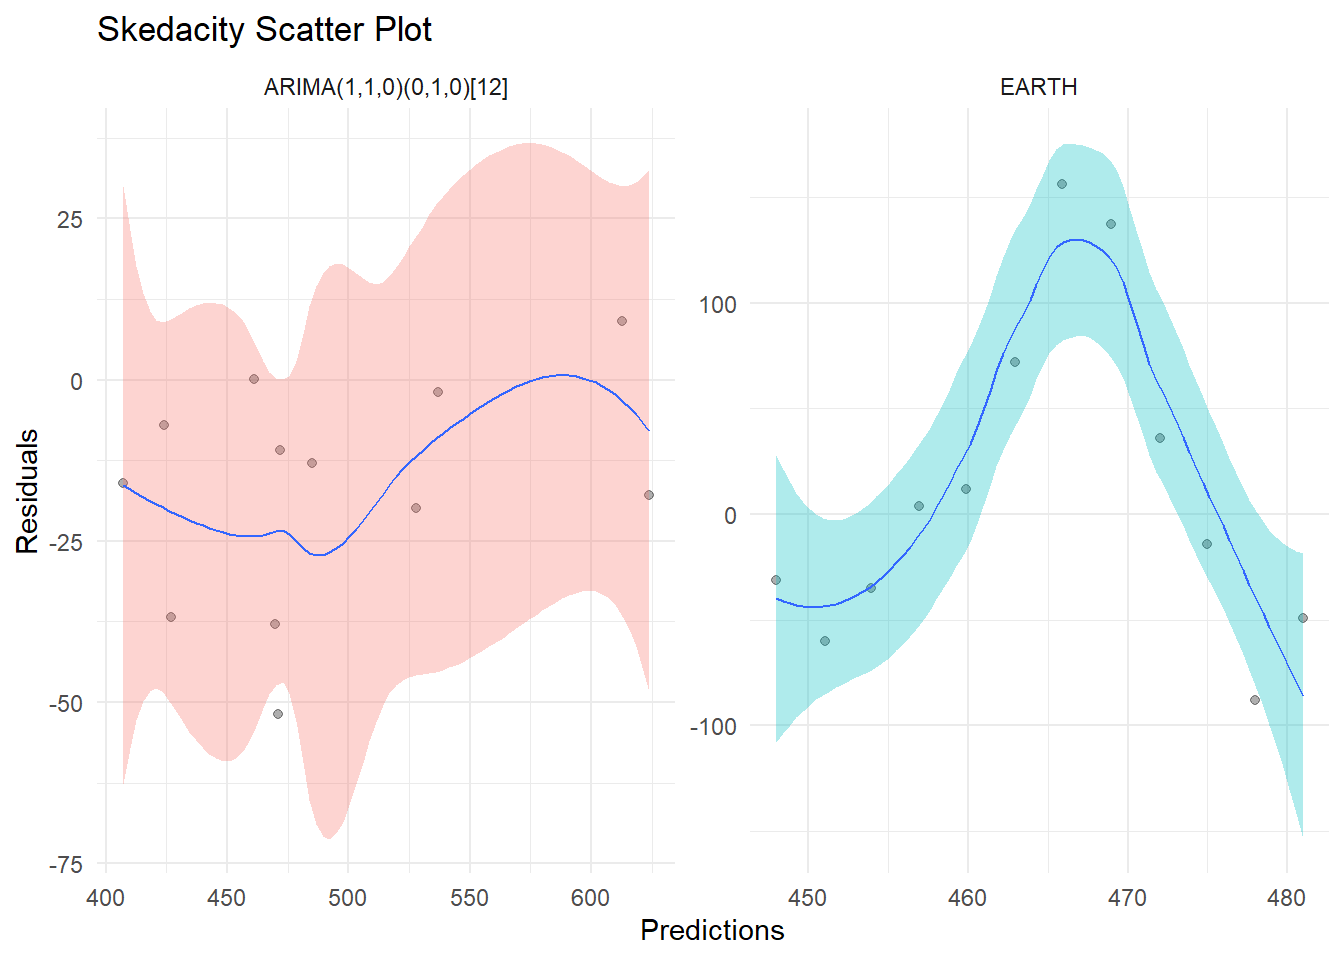
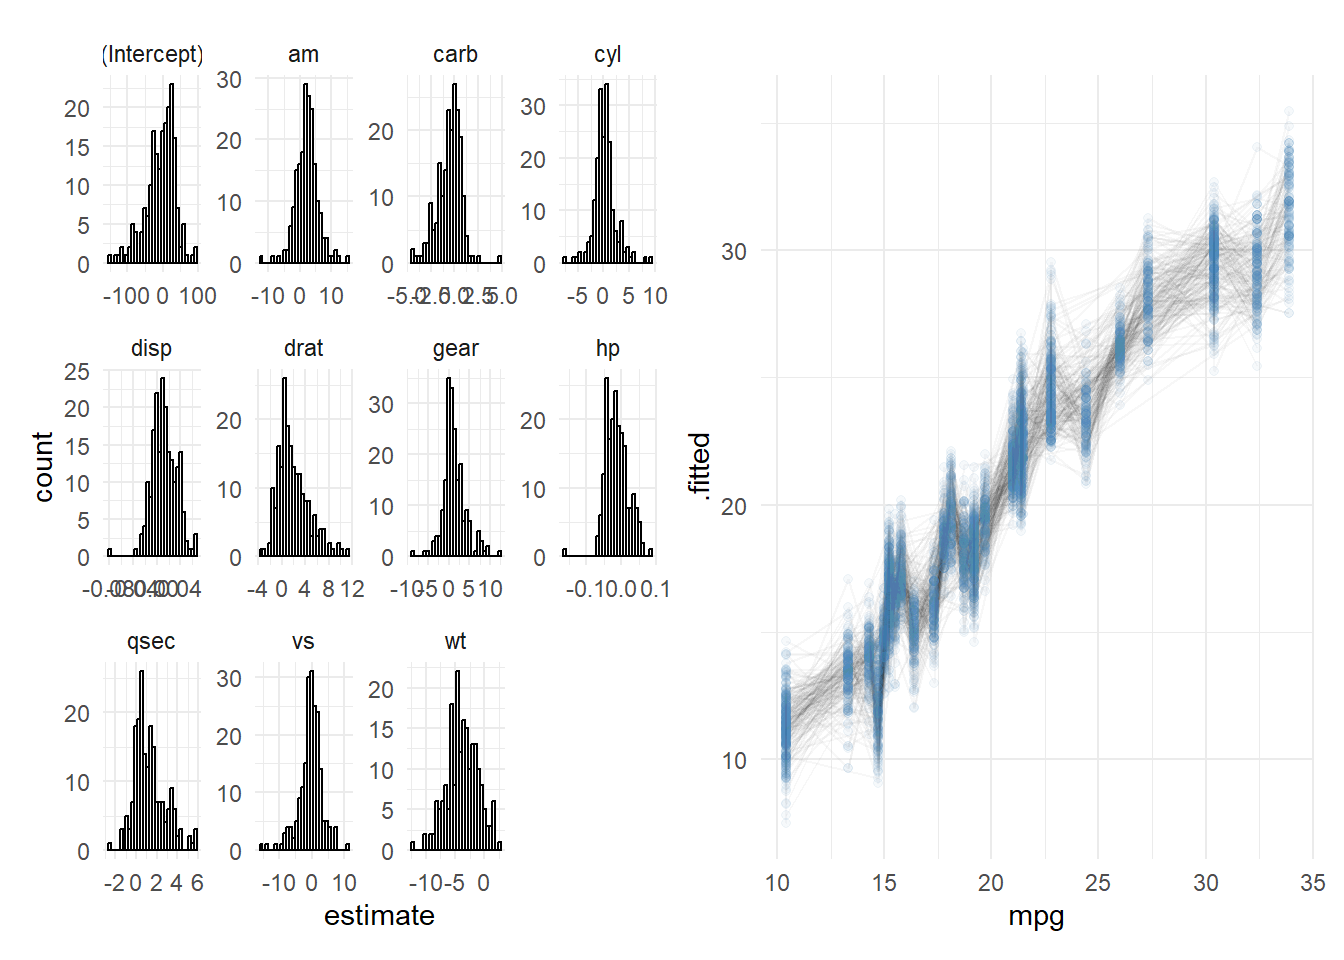
Introducing plot_regression_residuals() from tidyAML: Unveiling the Power of Visualizing Regression Residuals
tidyaml
rtip
data-analysis
data-science
🚀 Exciting News! 🚀
tidyaml
rtip
data-analysis
data-science
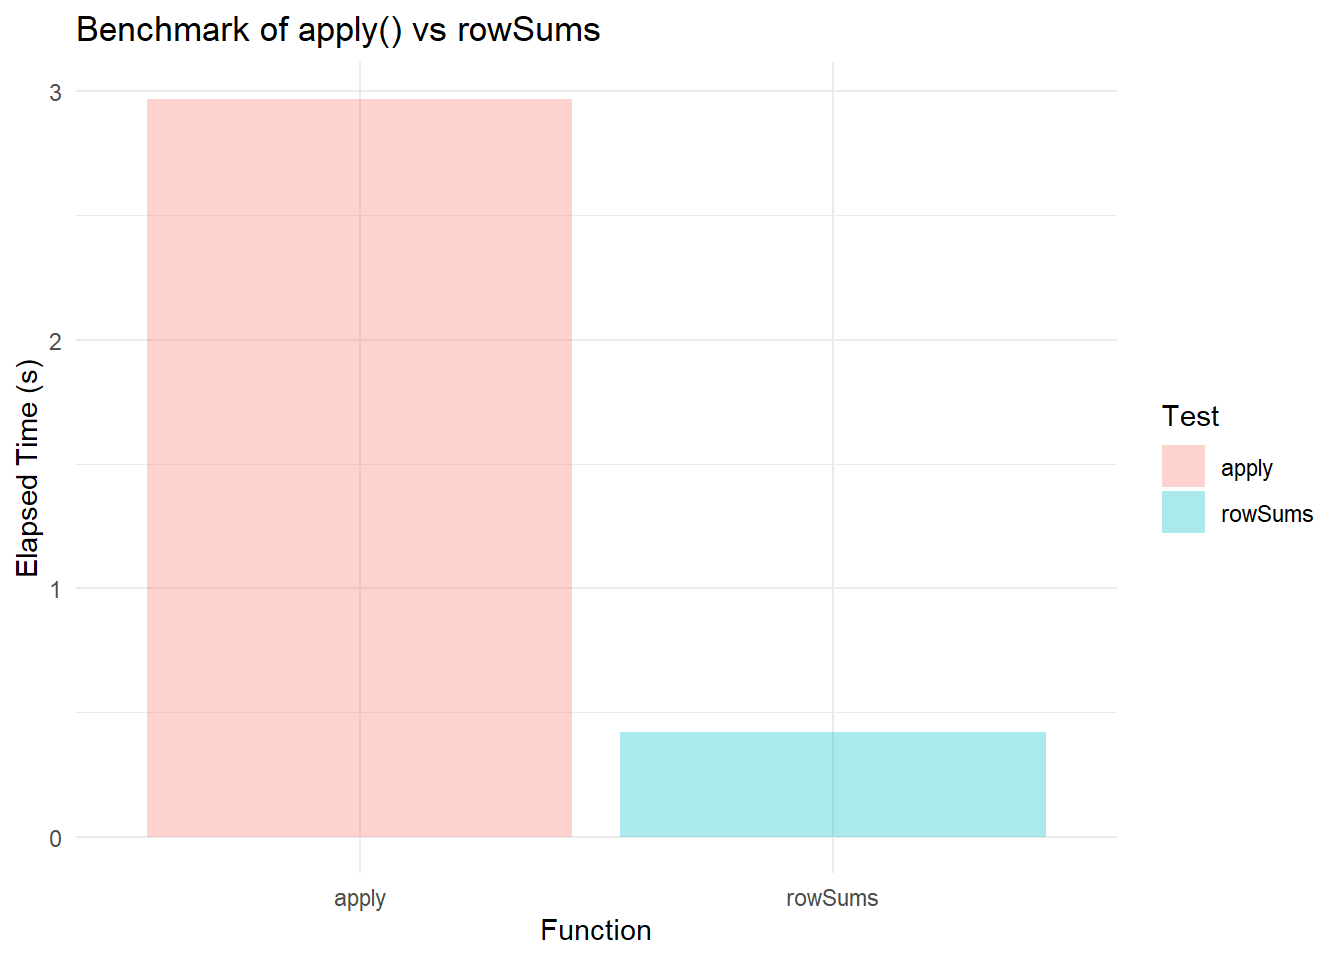
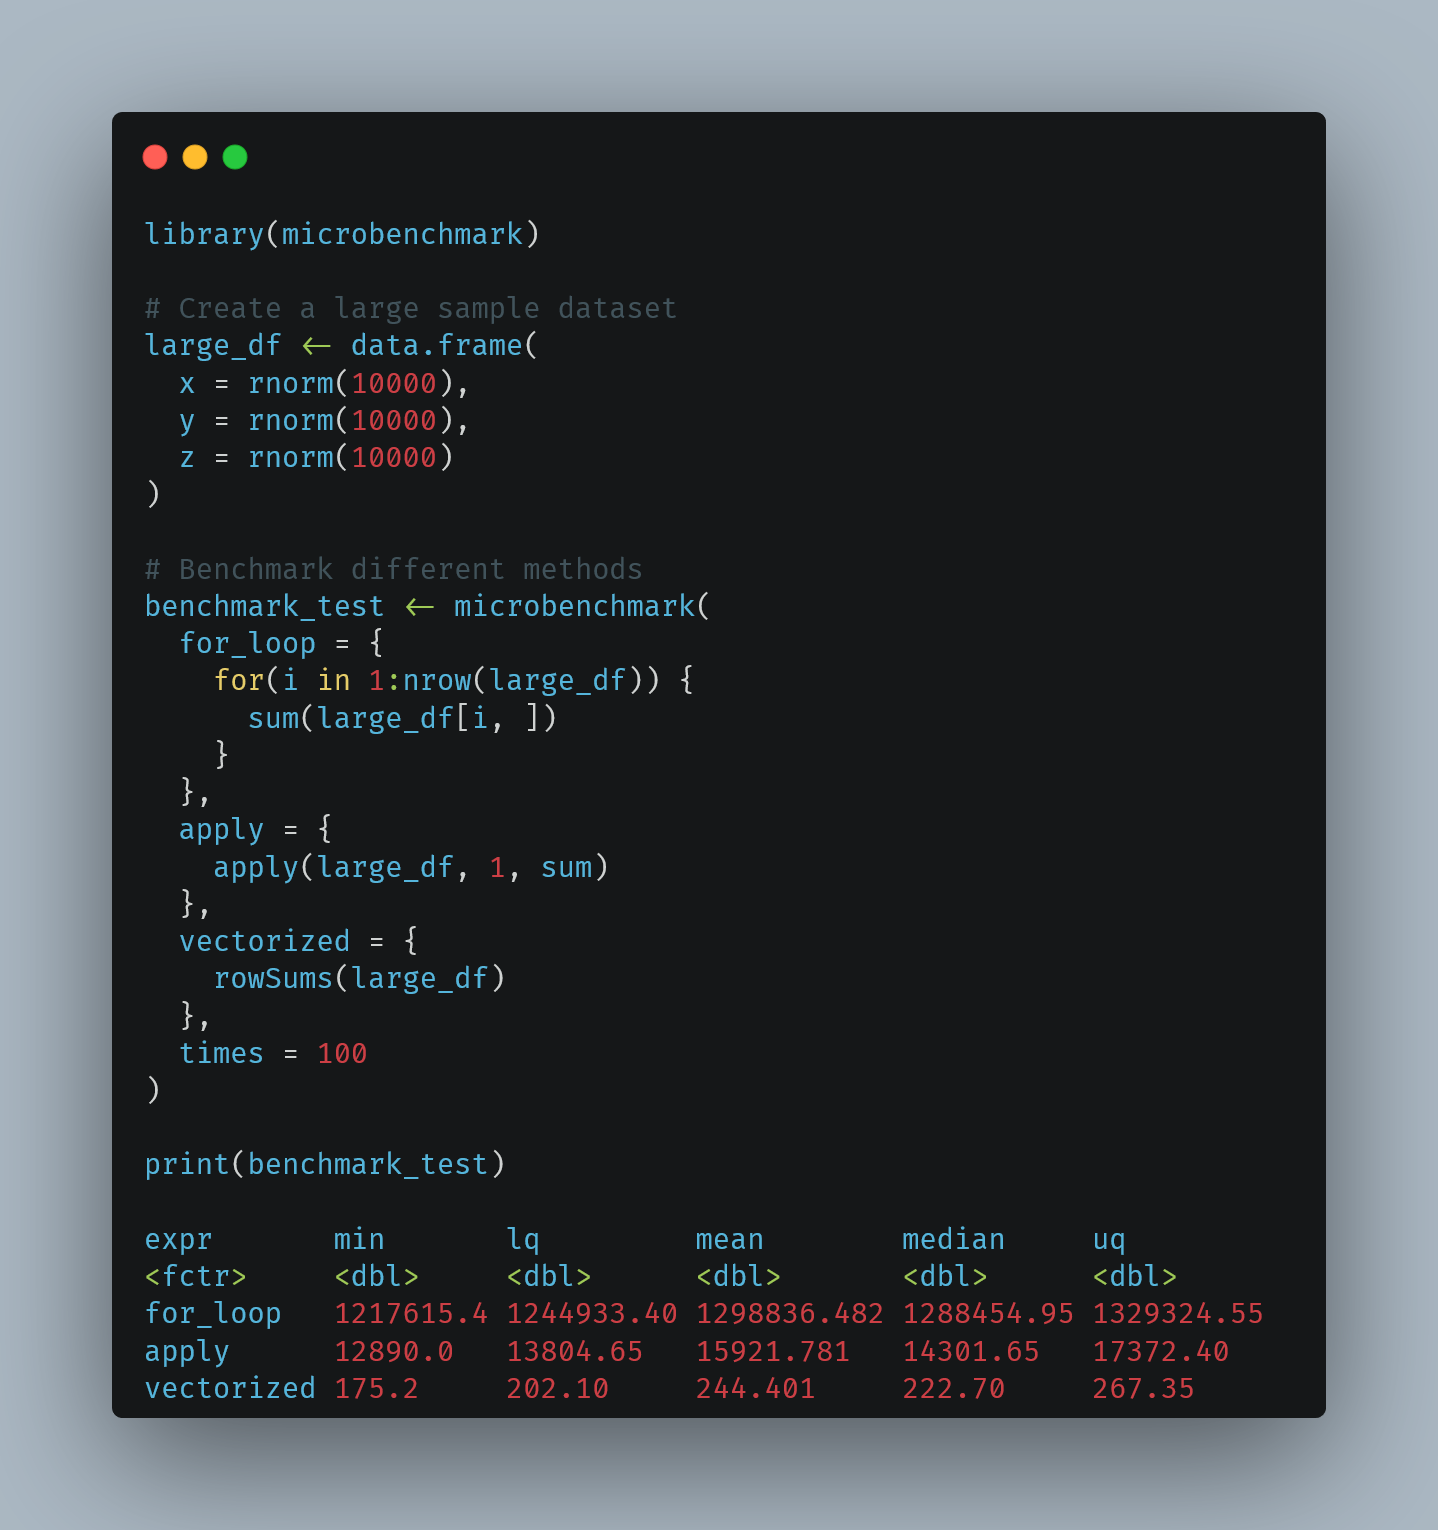
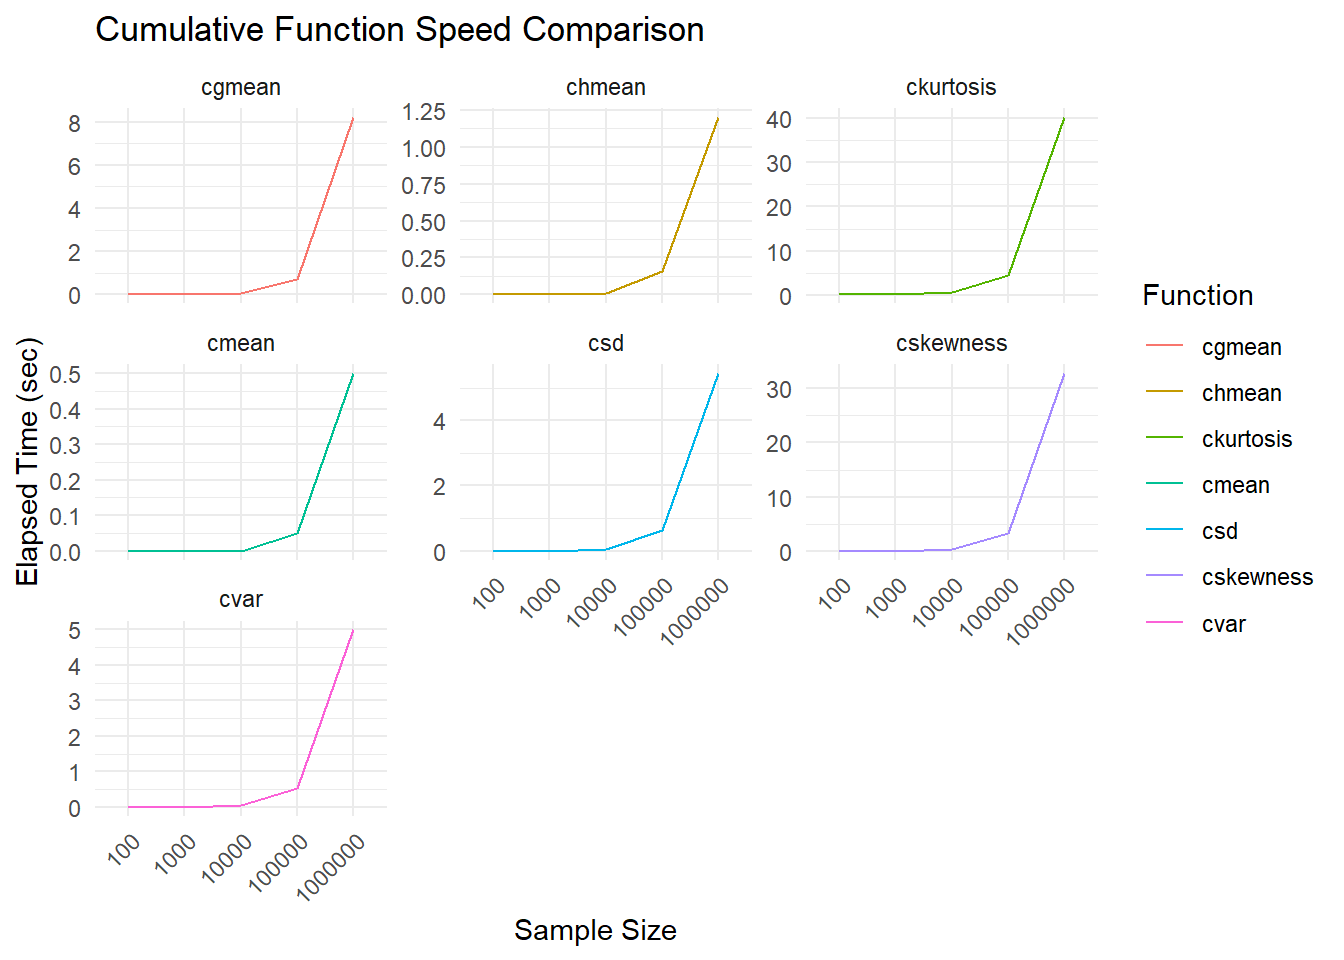
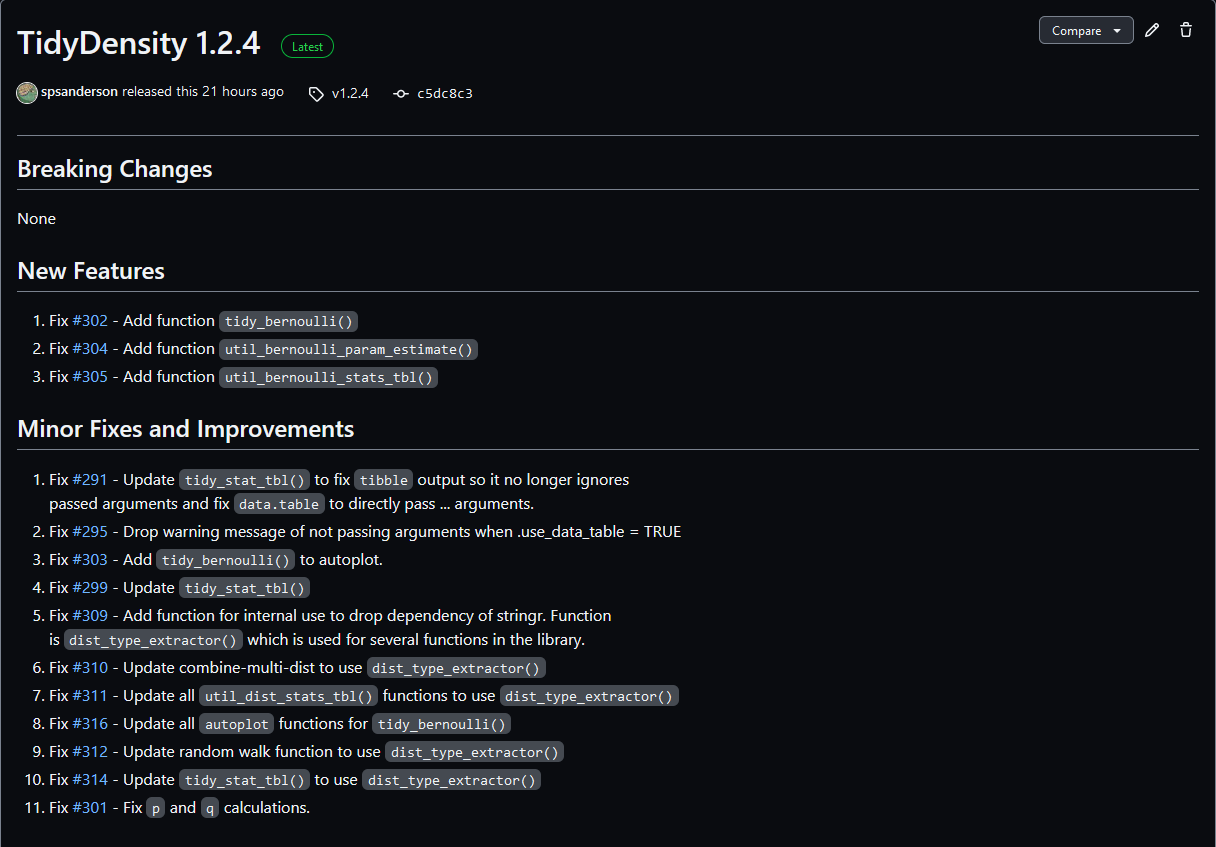
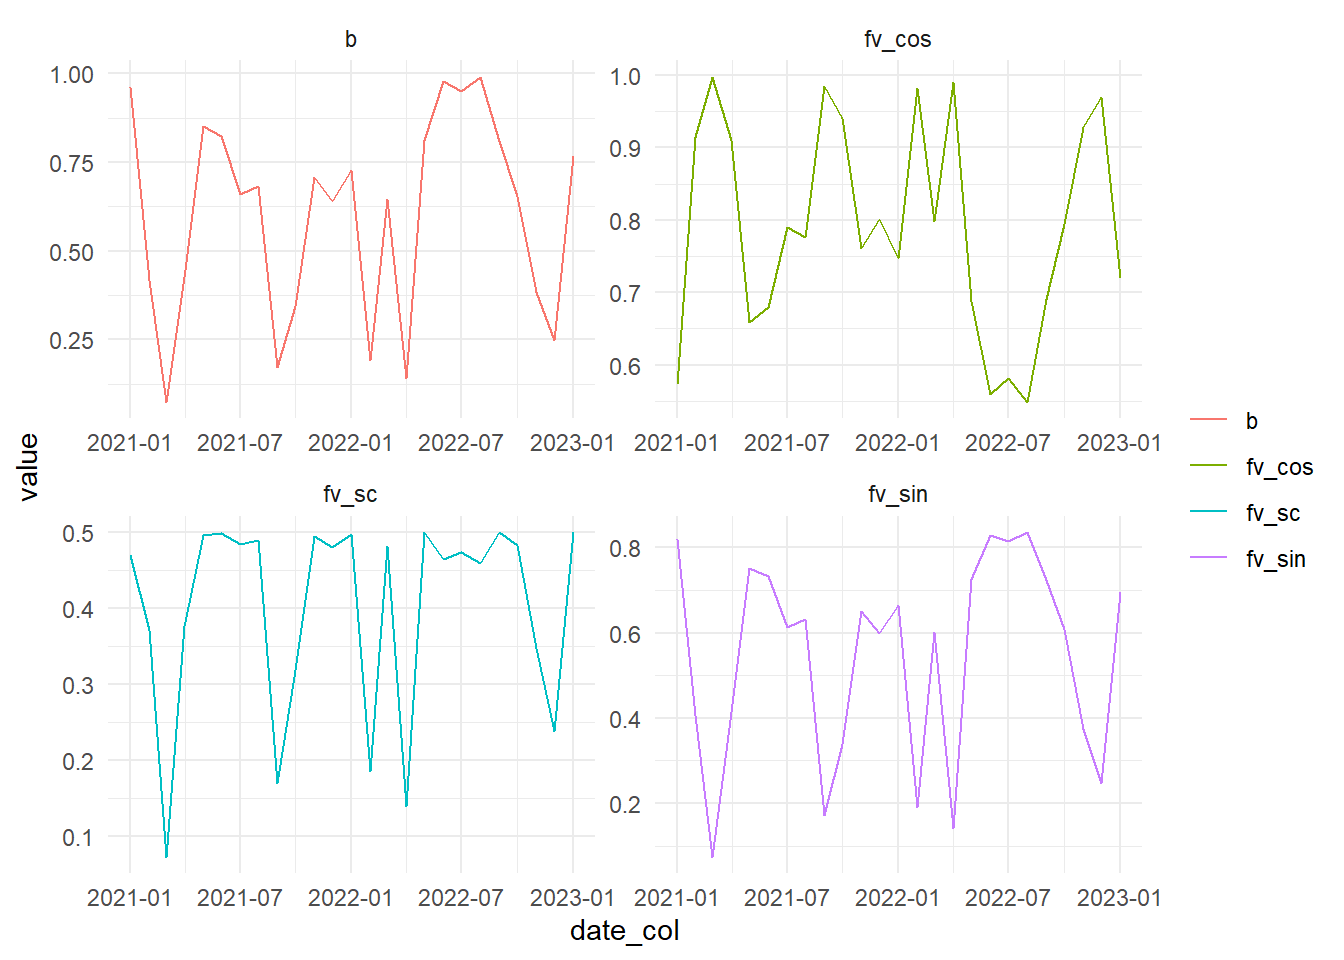
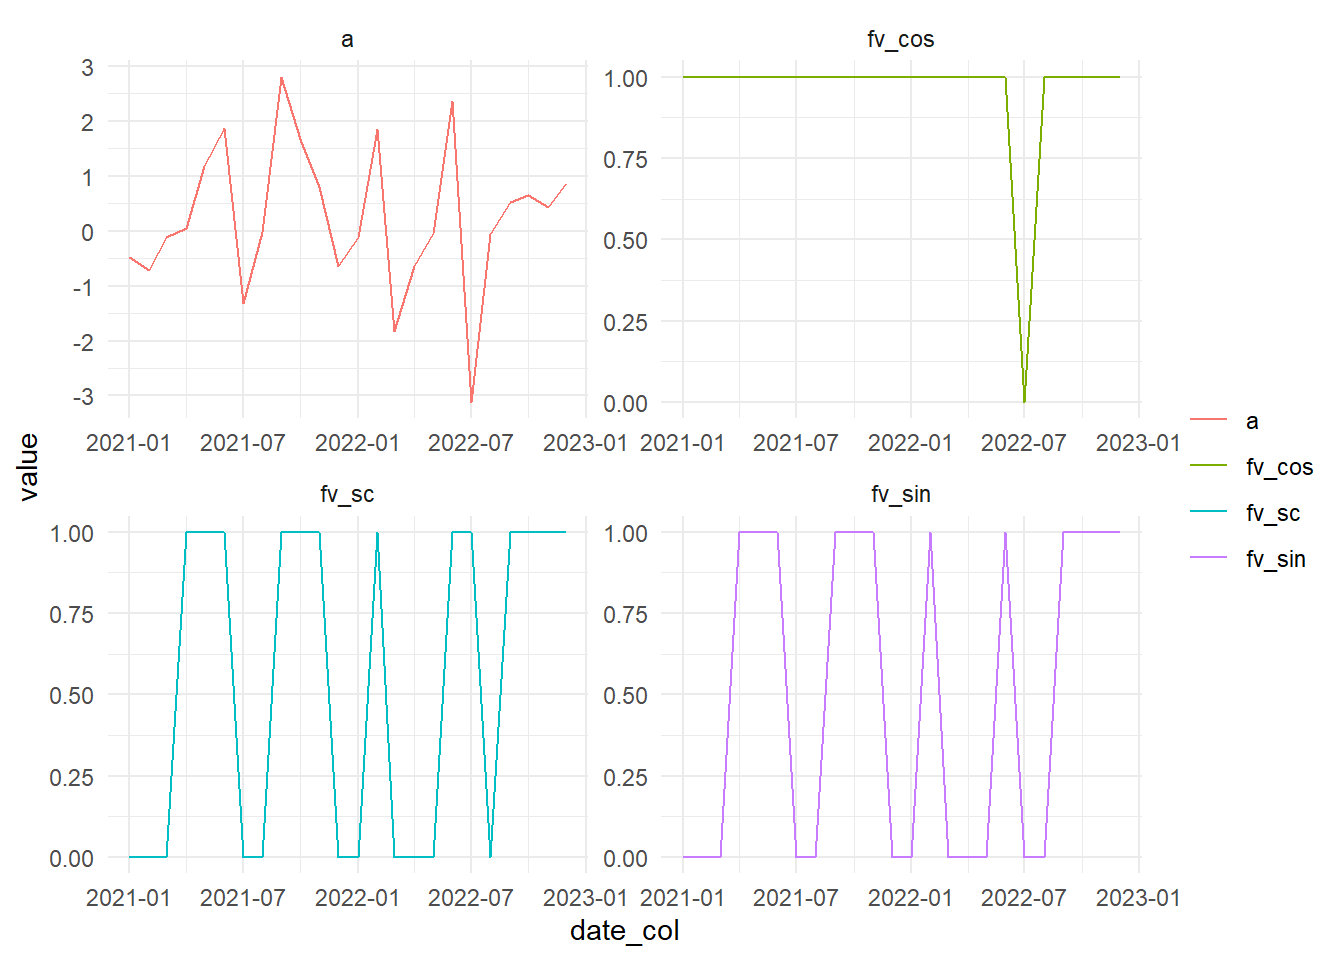
TidyDensity Powers Up with Data.table: Speedier Distributions for Your Data Exploration
code
benchmark
datatable
tidydensity


![]()


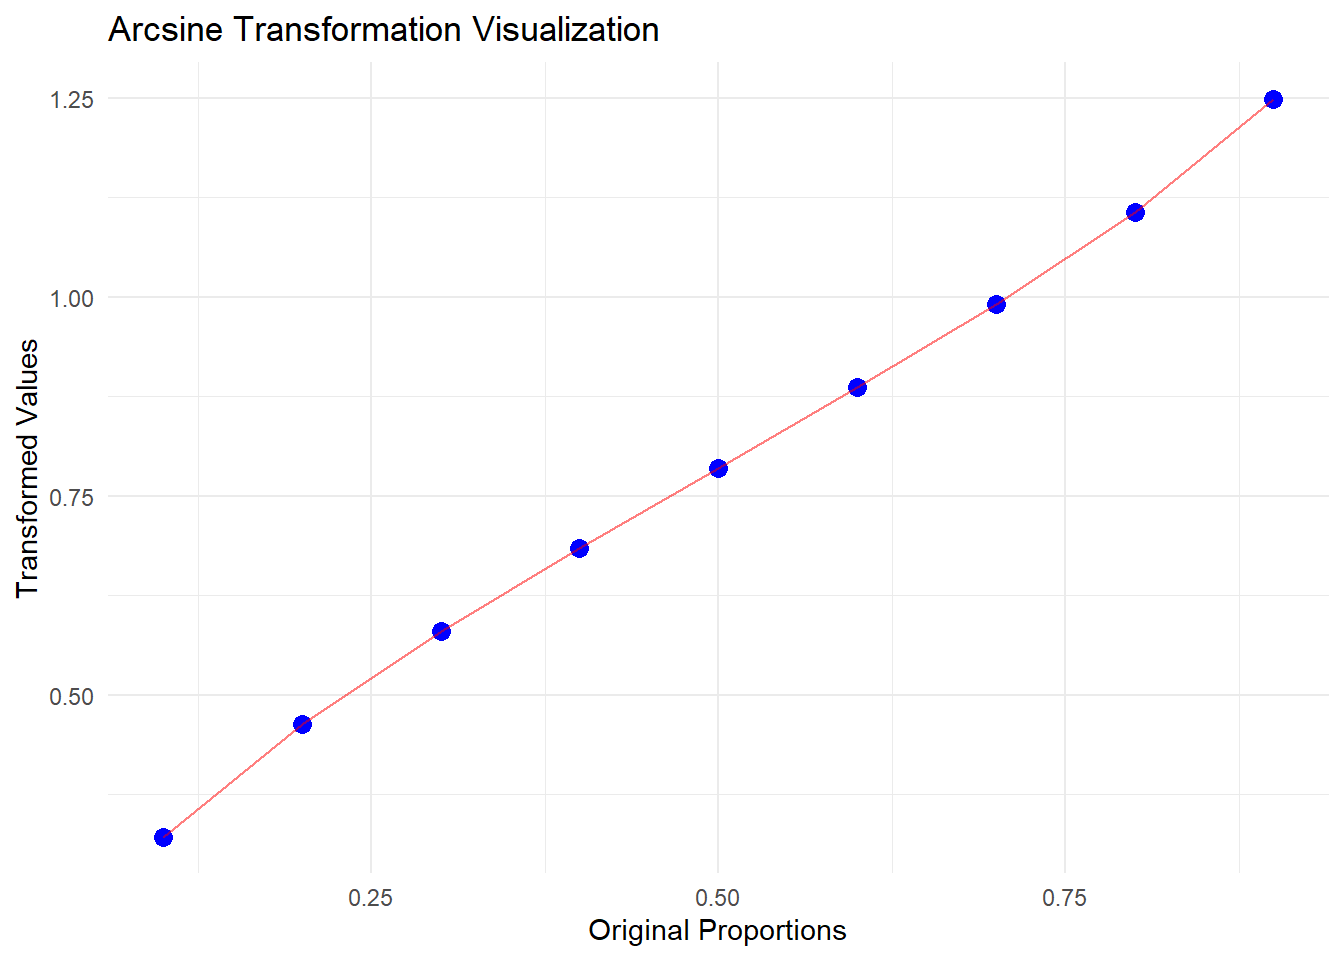
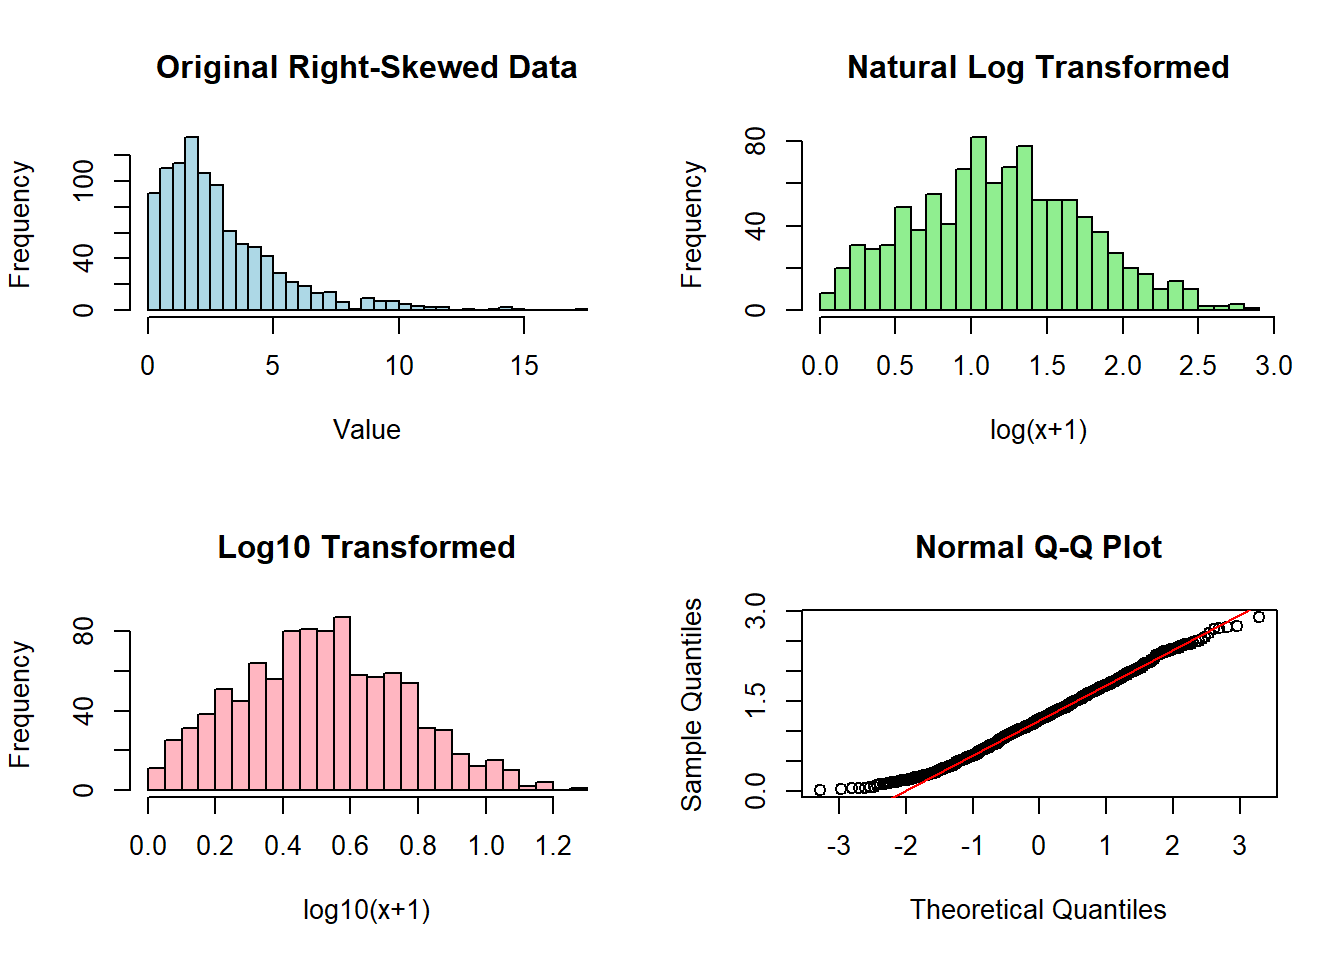
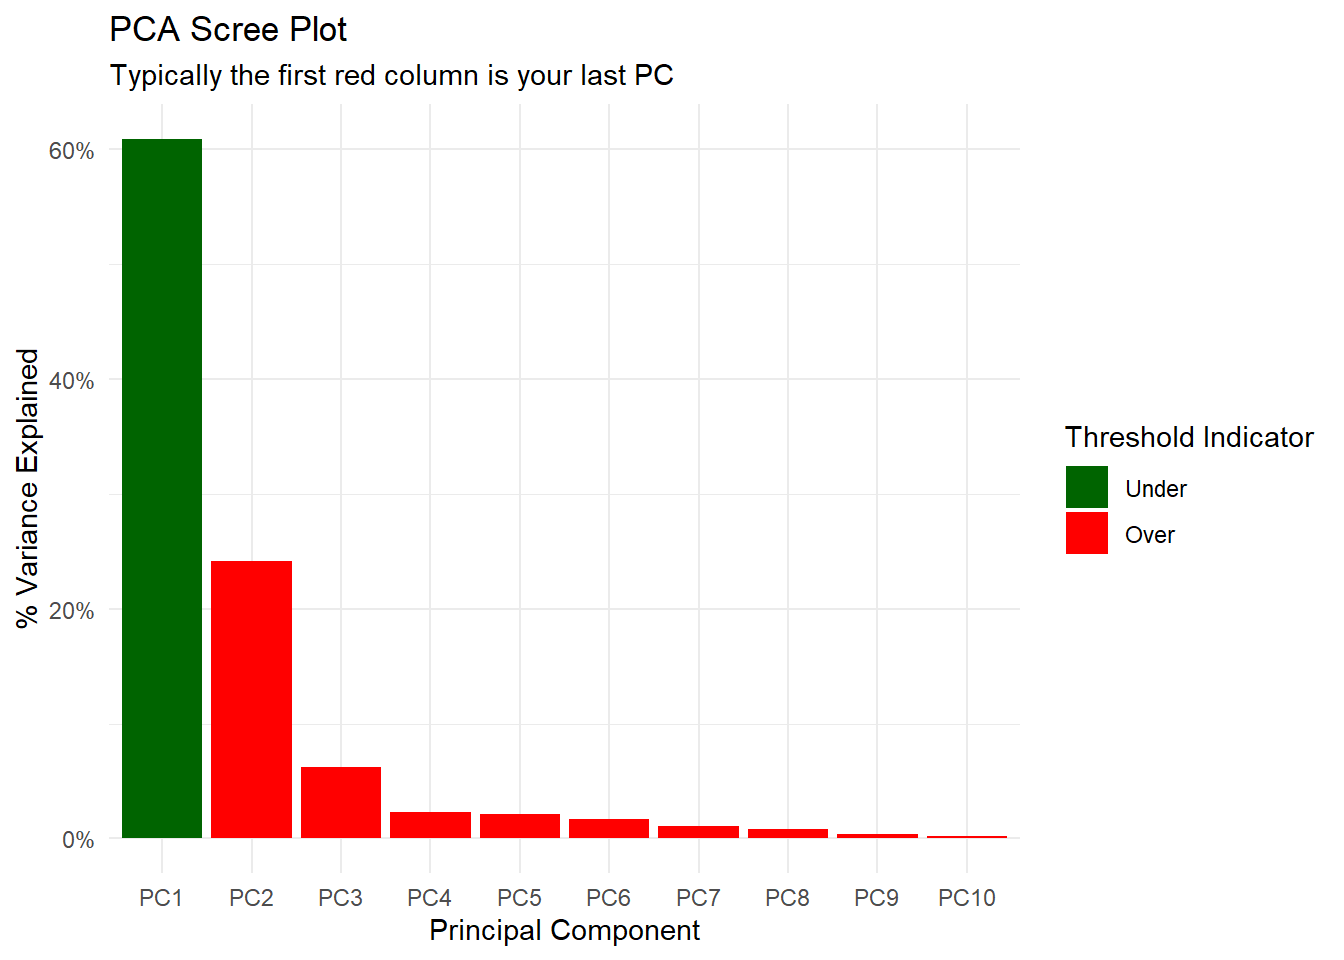
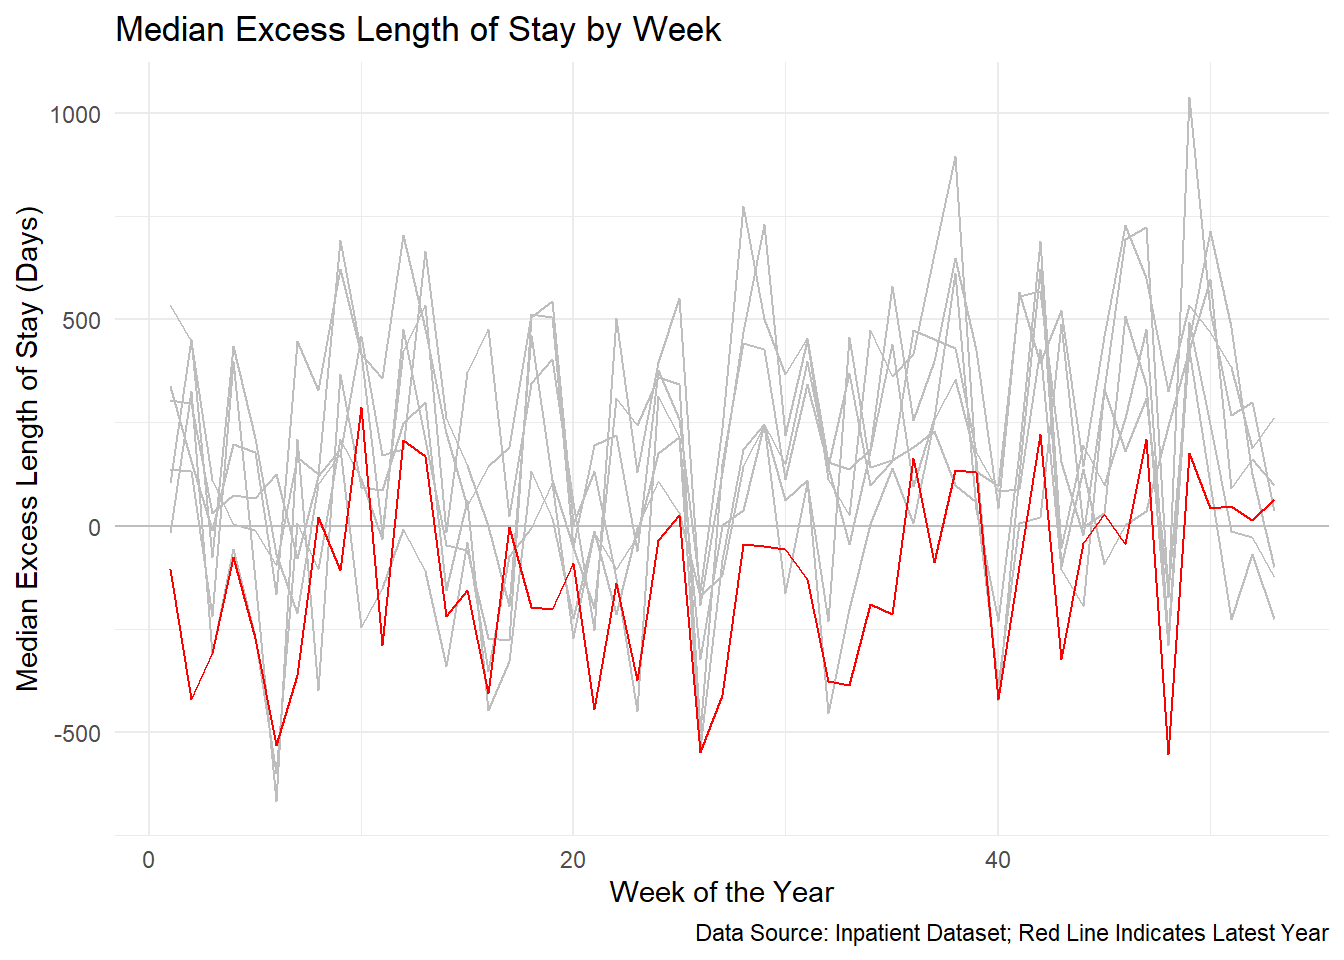
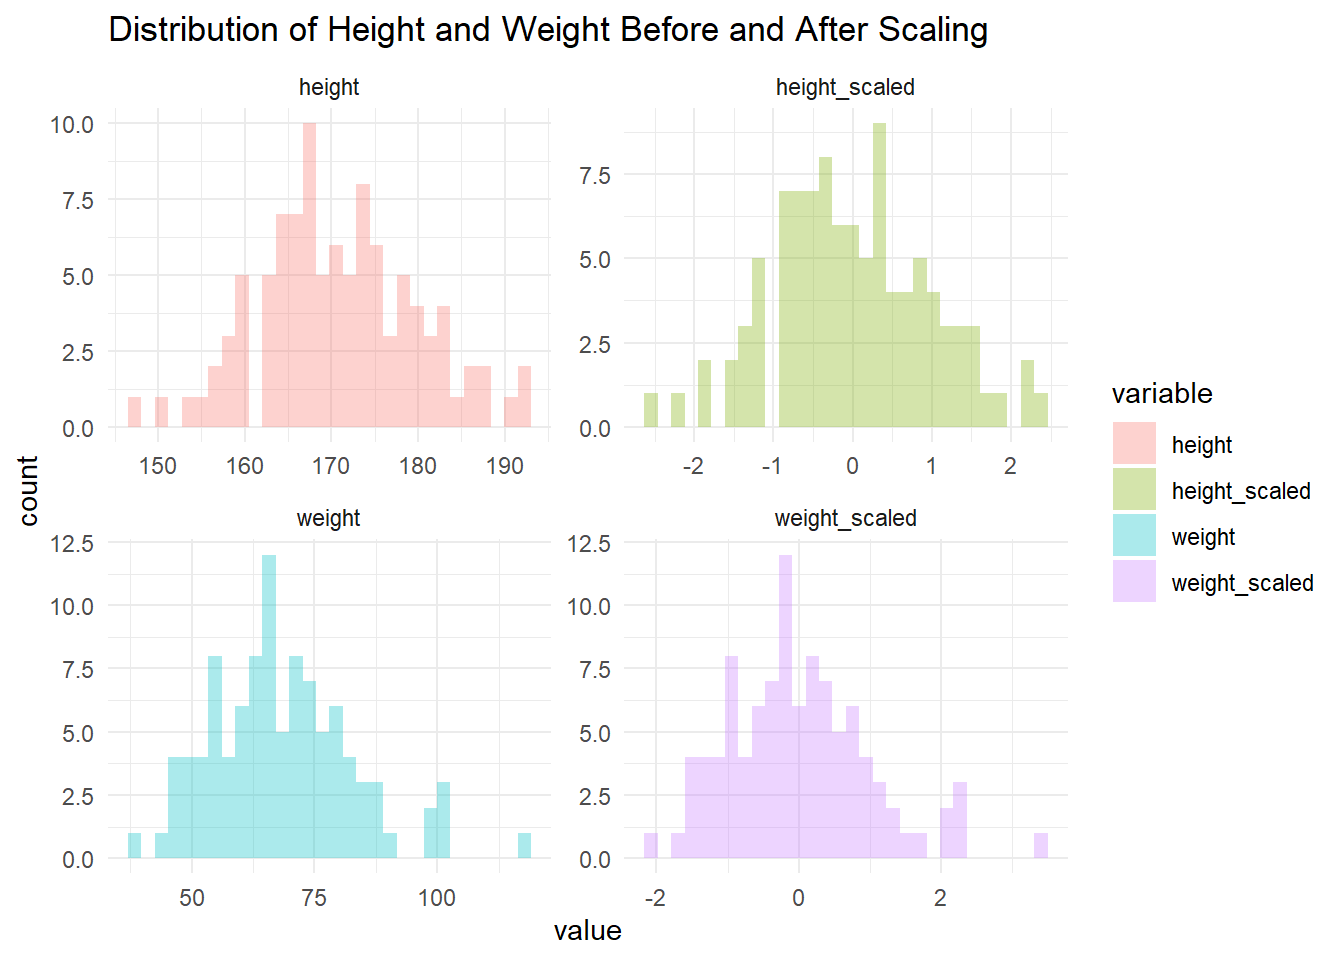
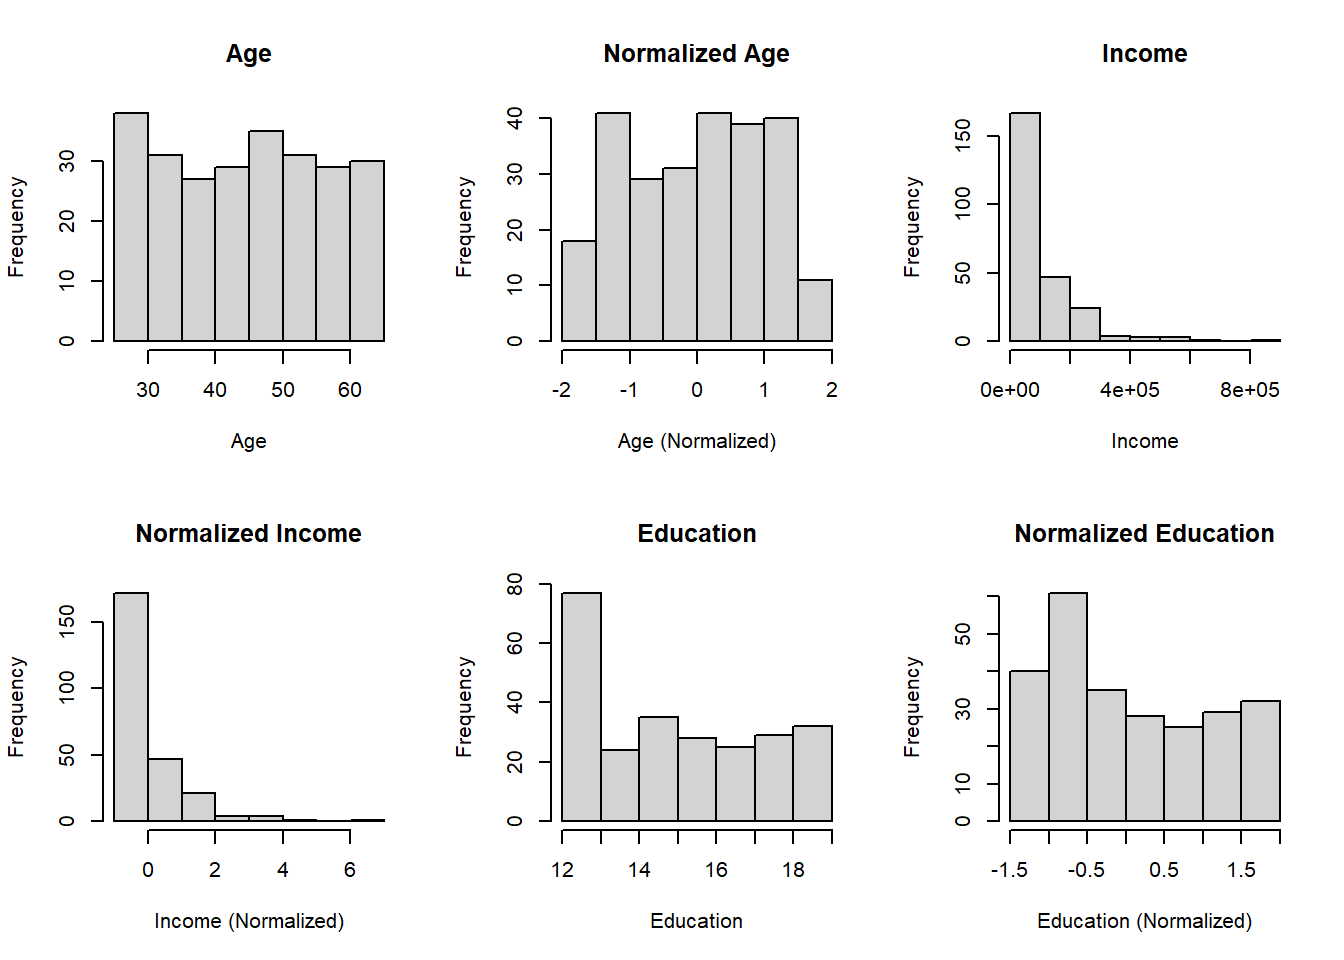
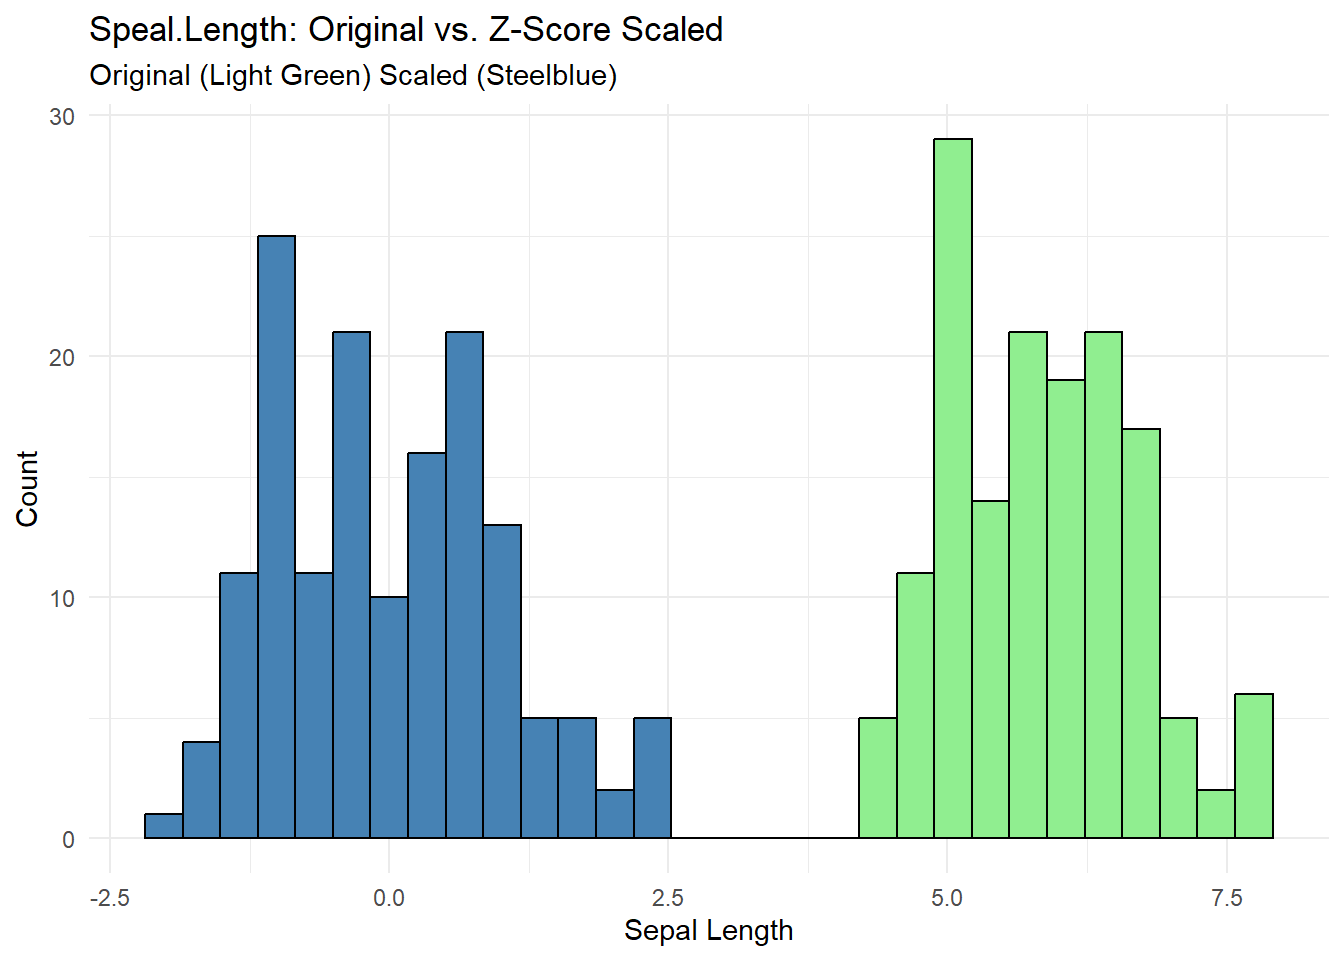
Transforming Your Data: A Guide to Popular Methods and How to Implement Them with {healthyR.ai}
code
rtip
transforms
healthyrai

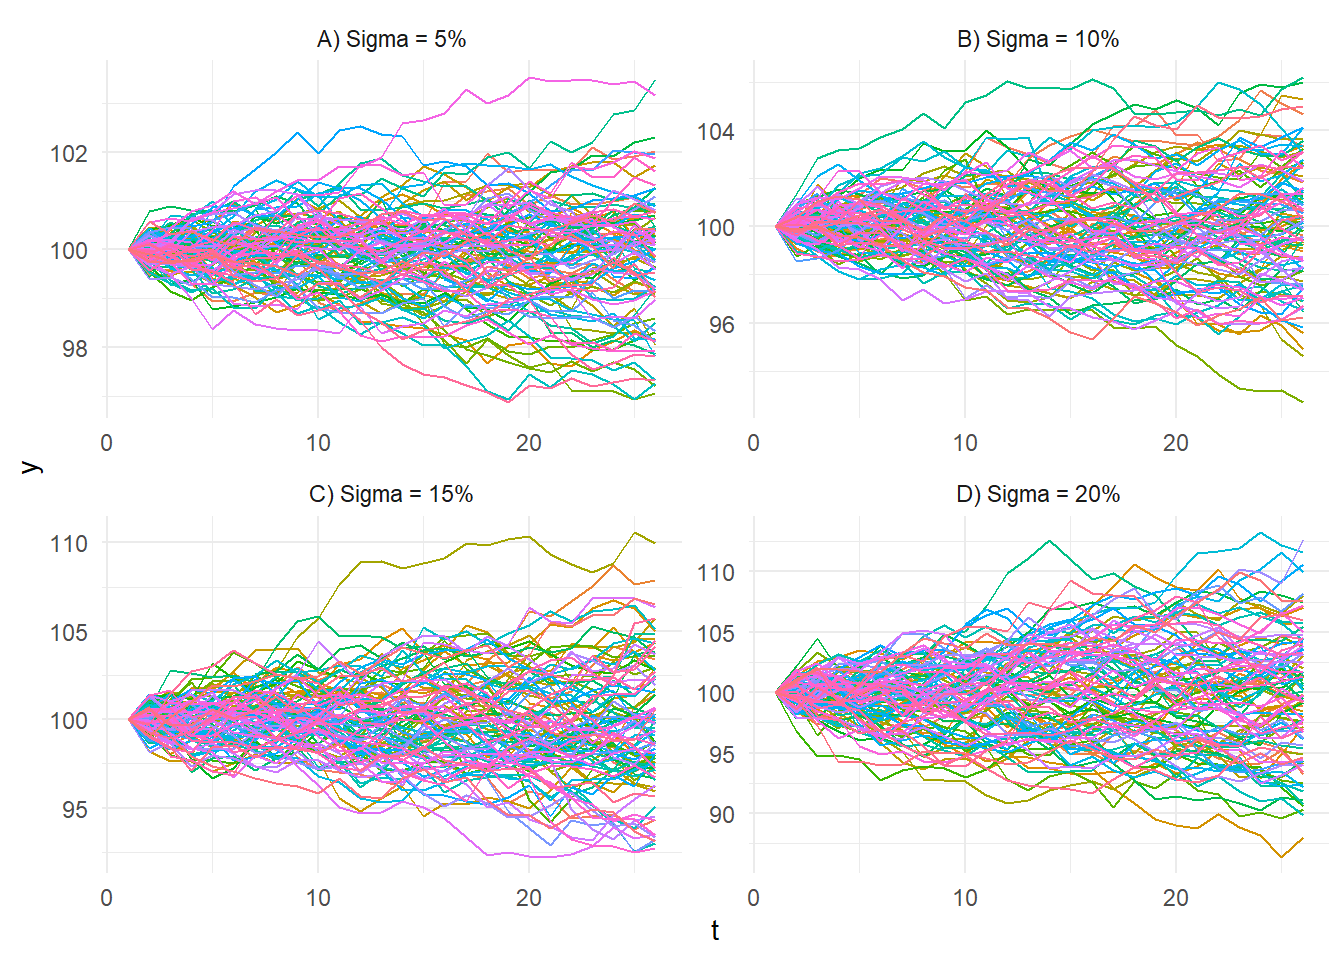
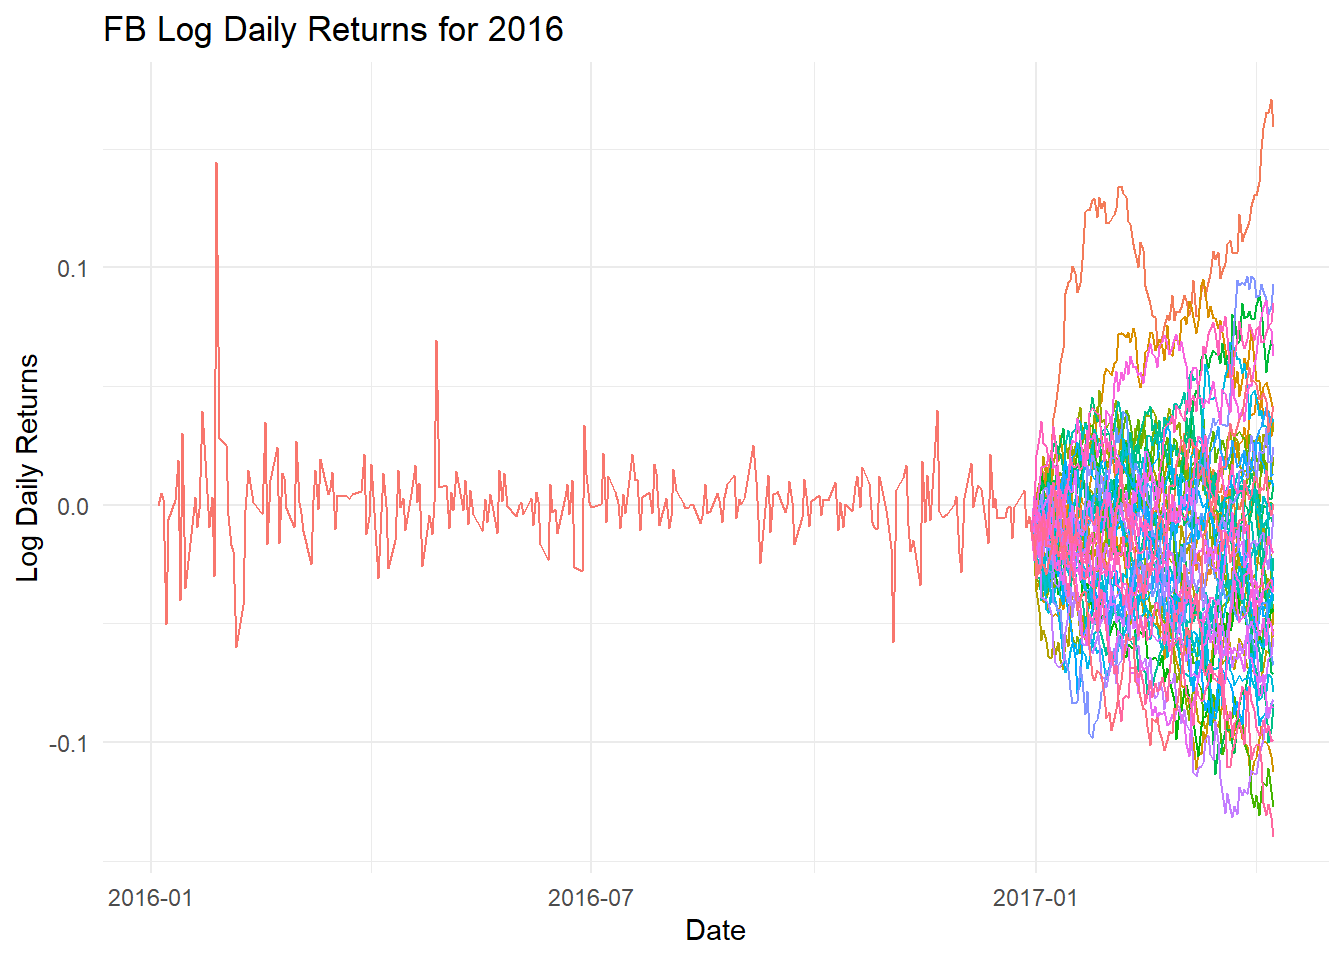
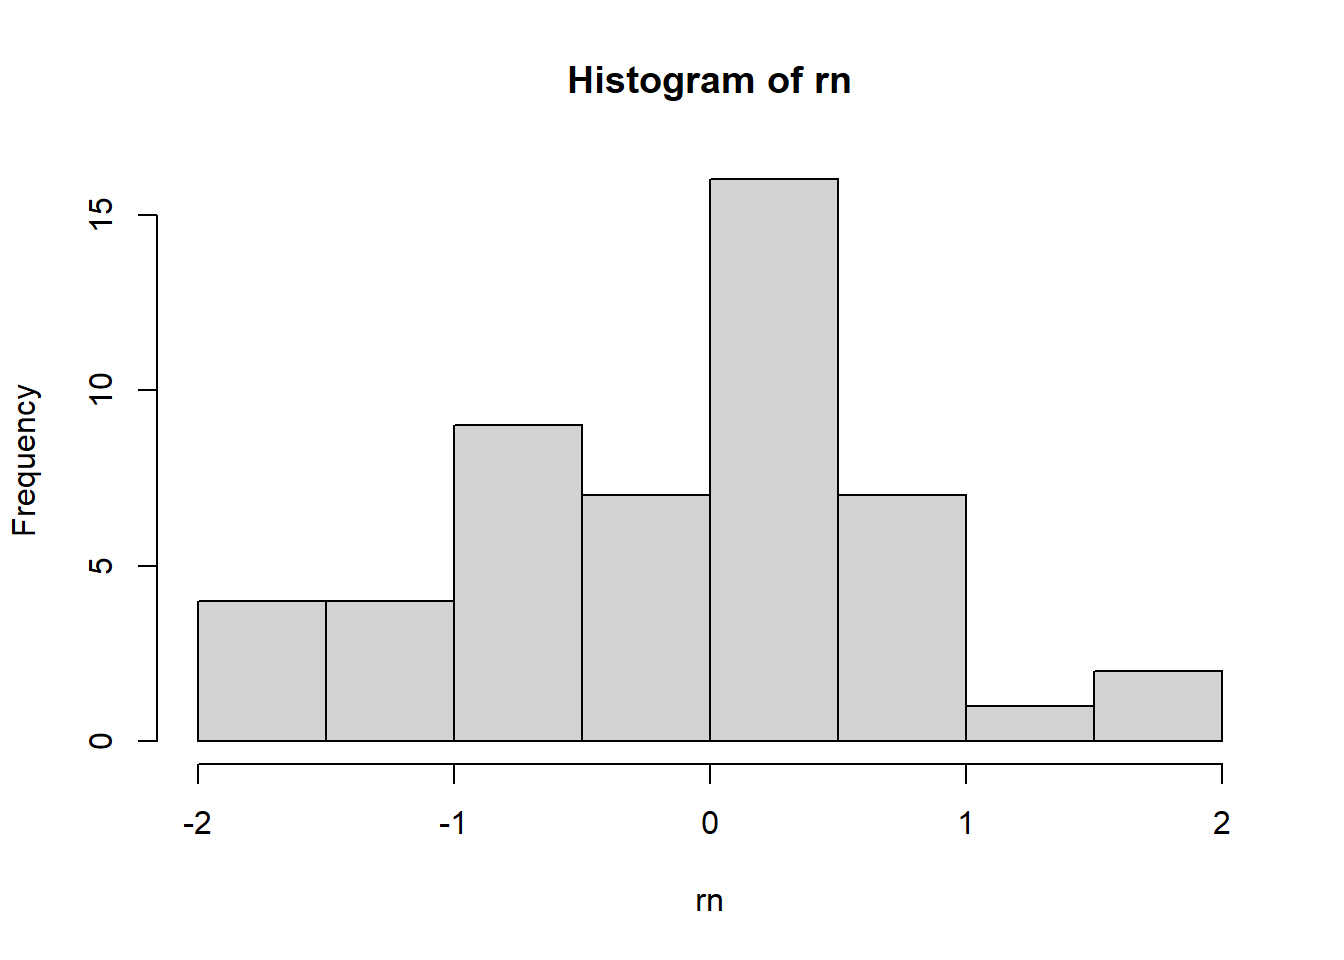
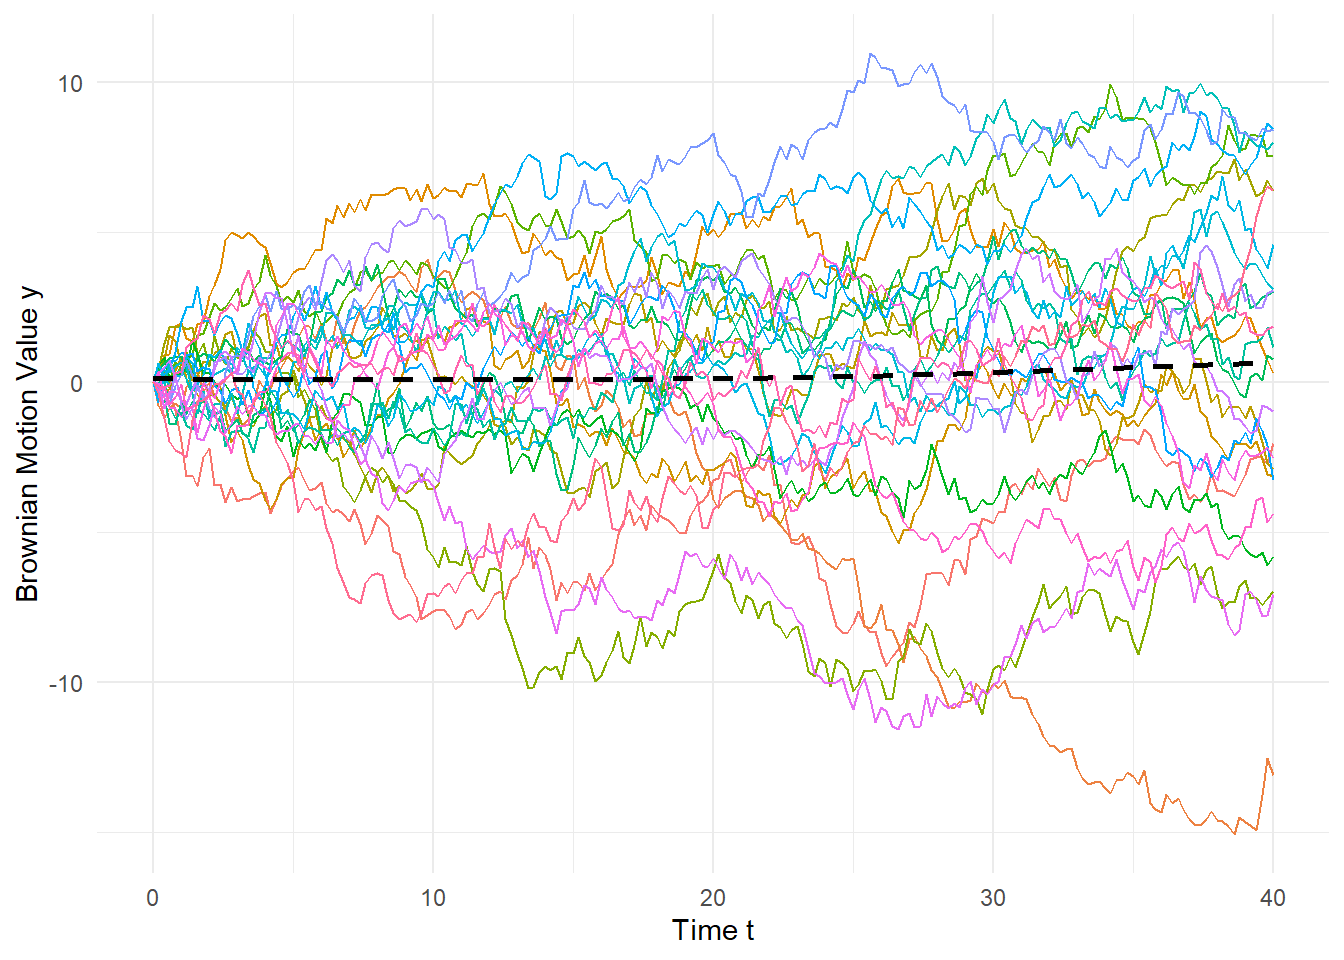
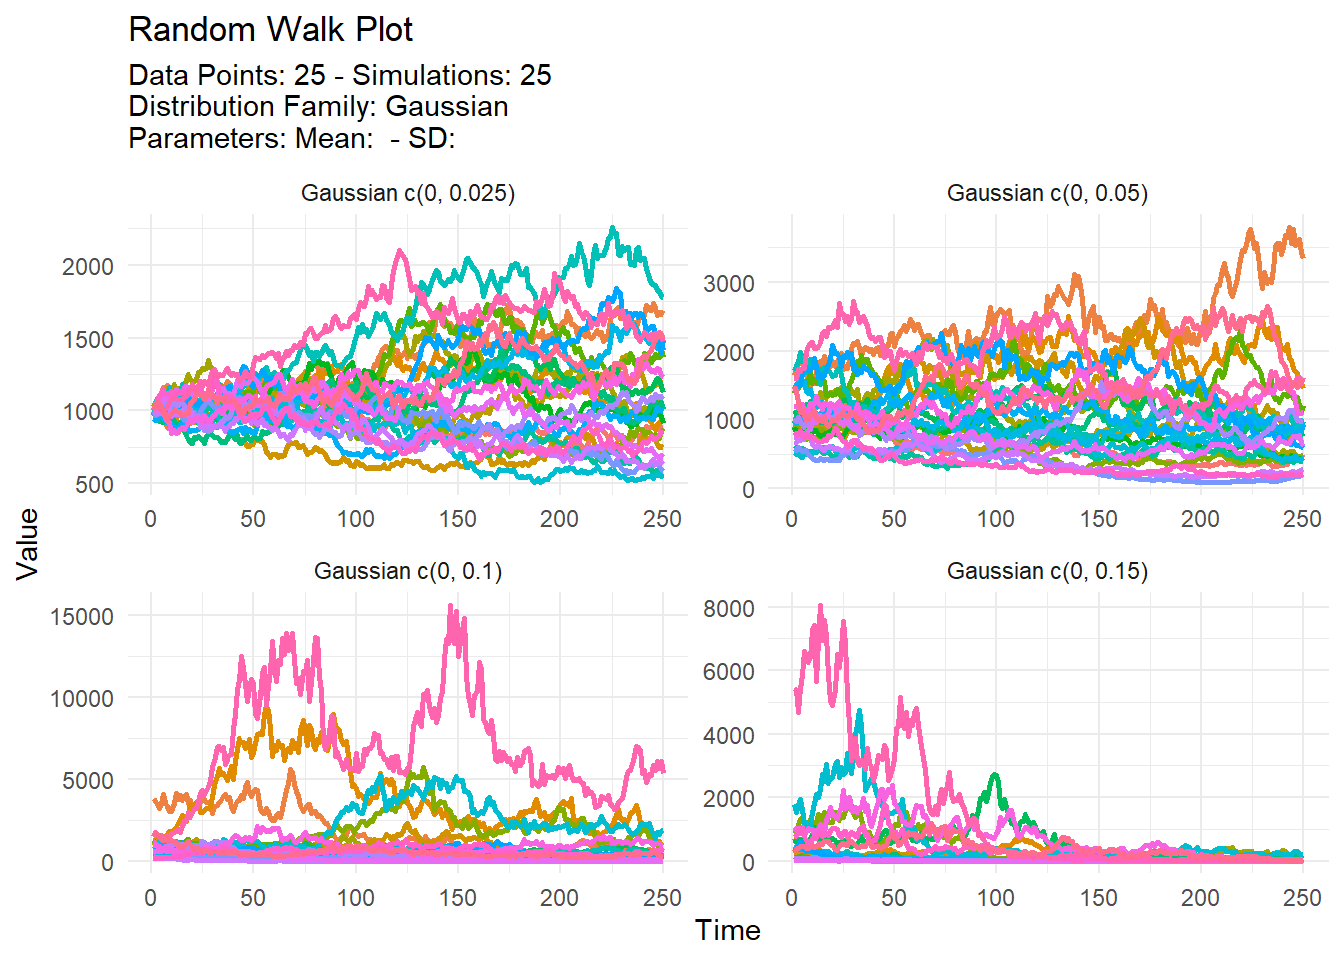
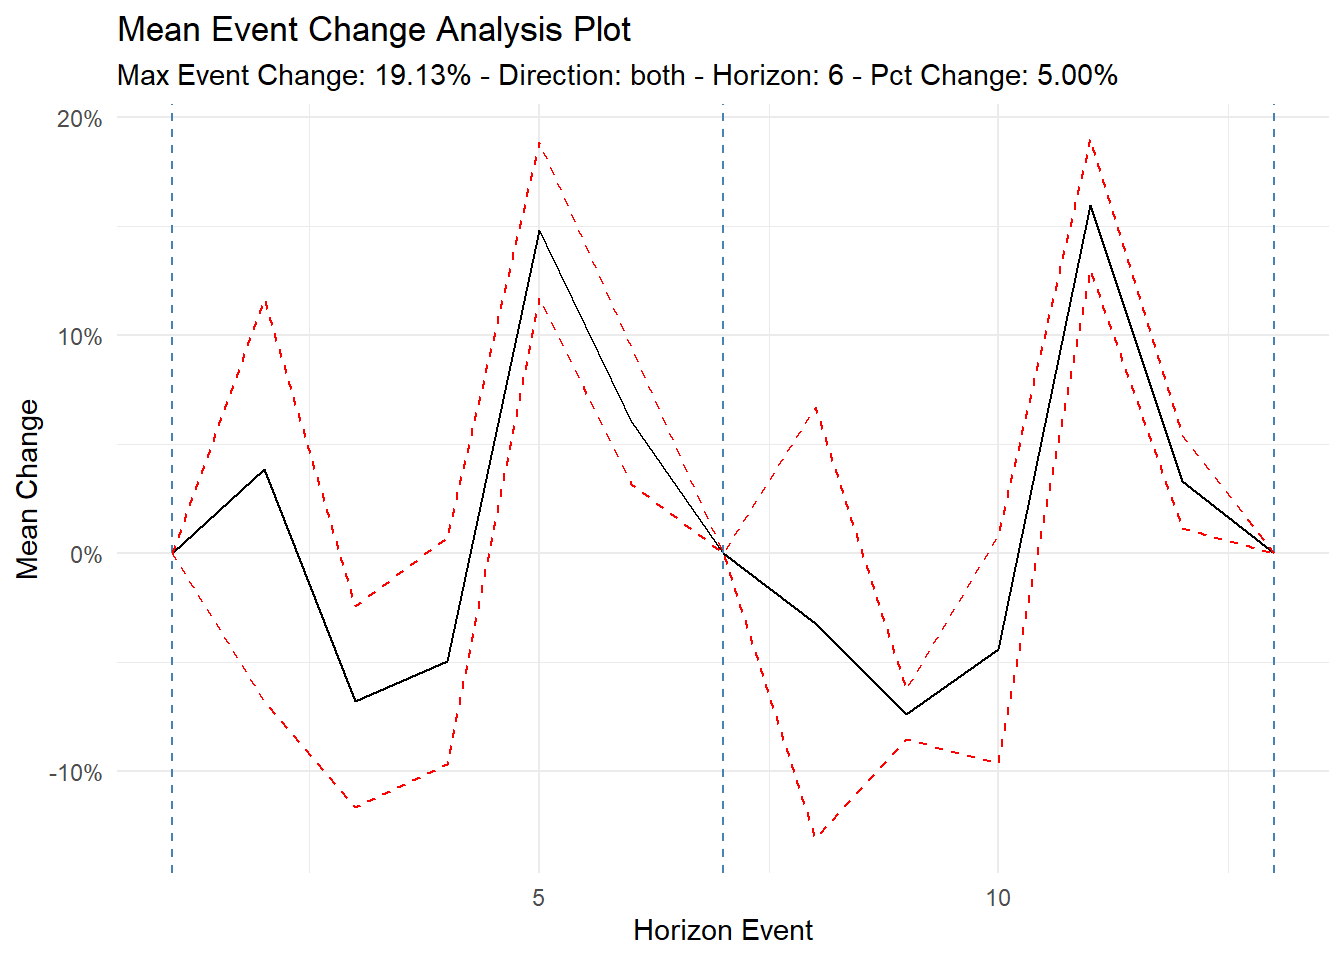
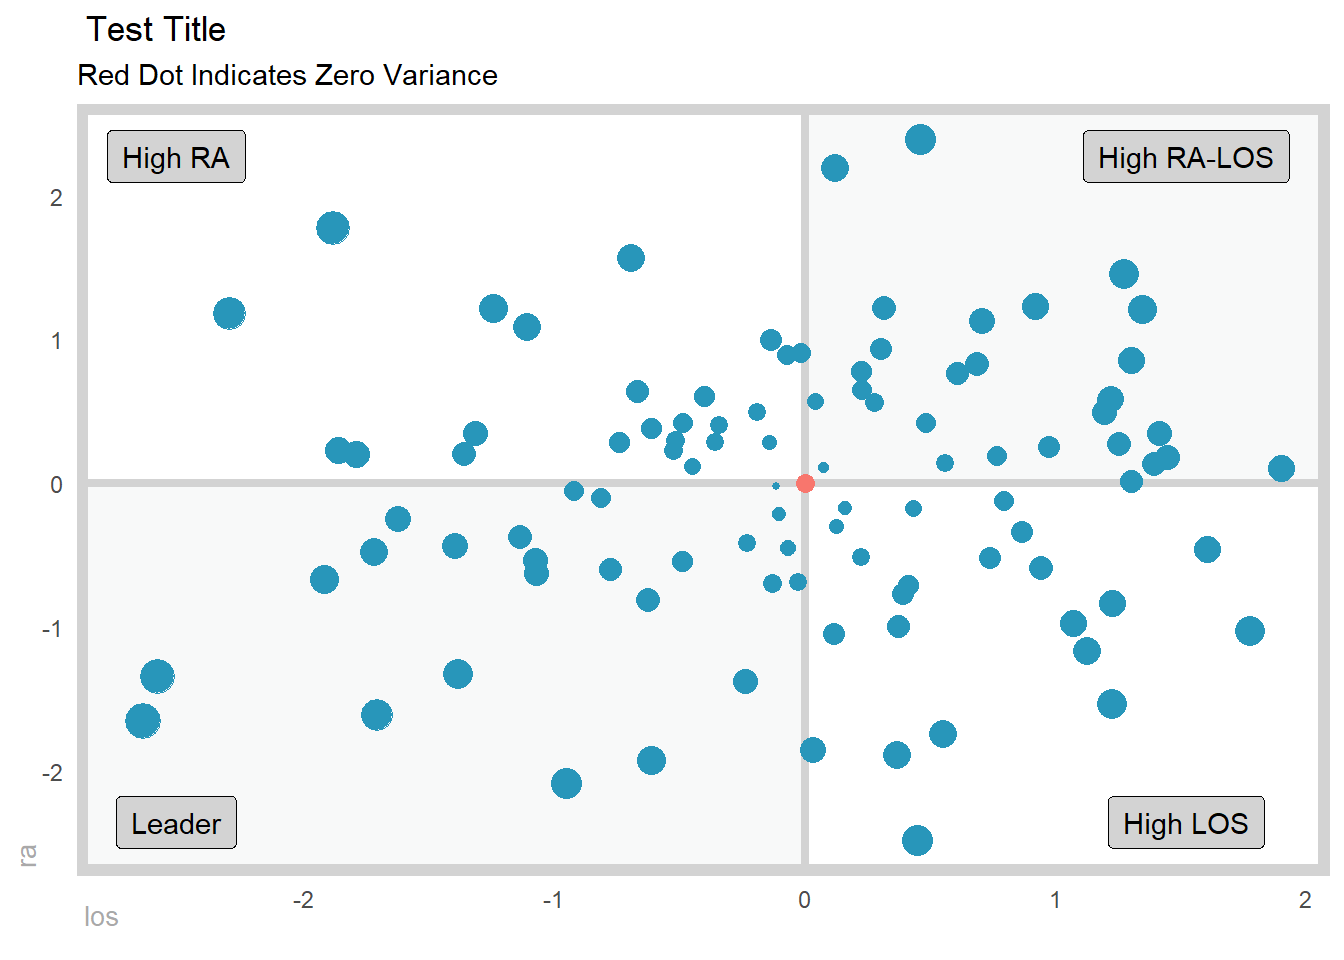
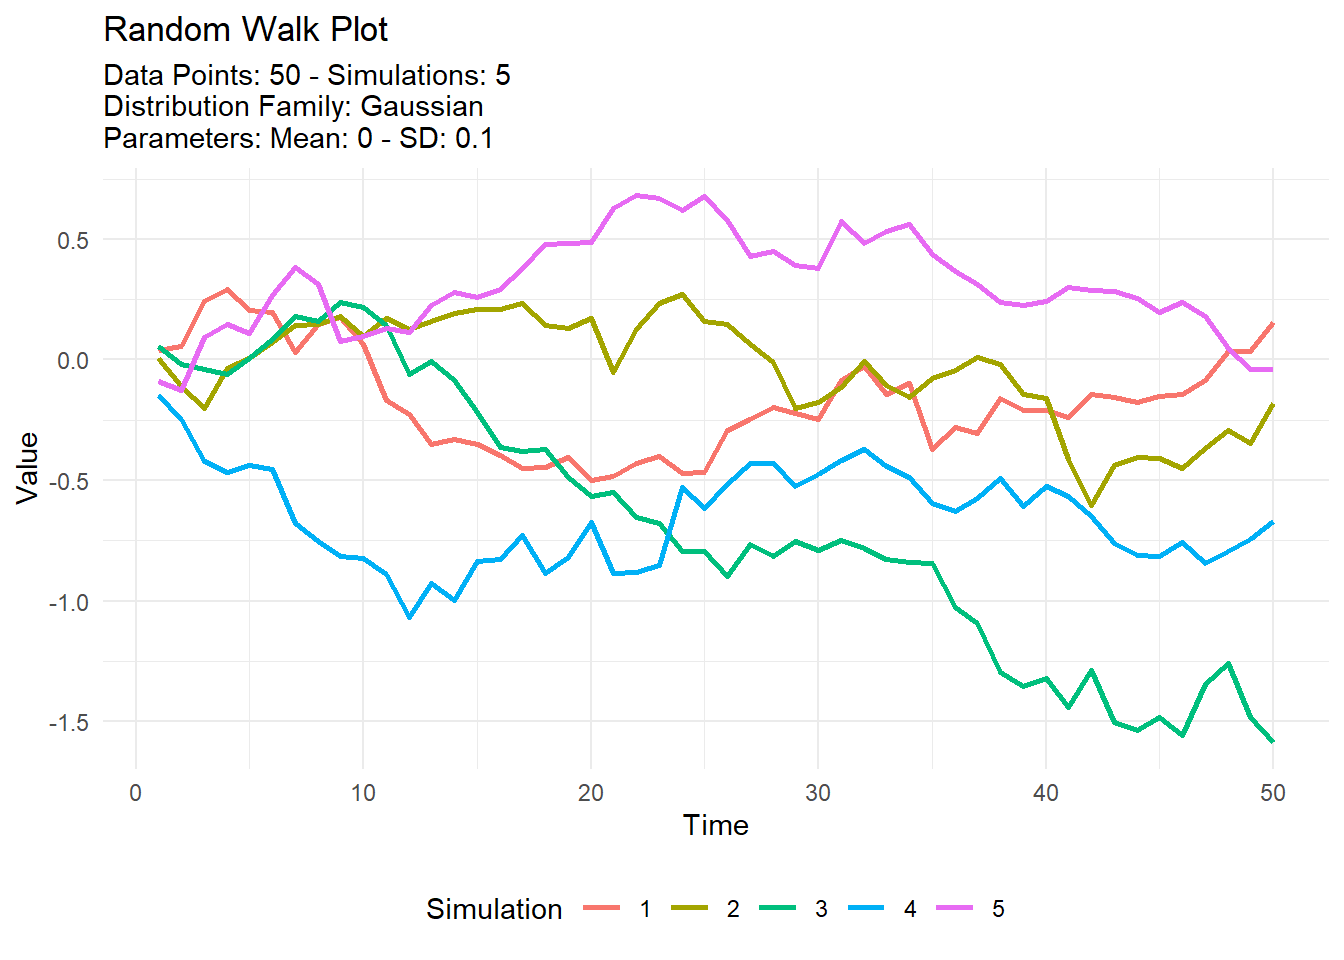
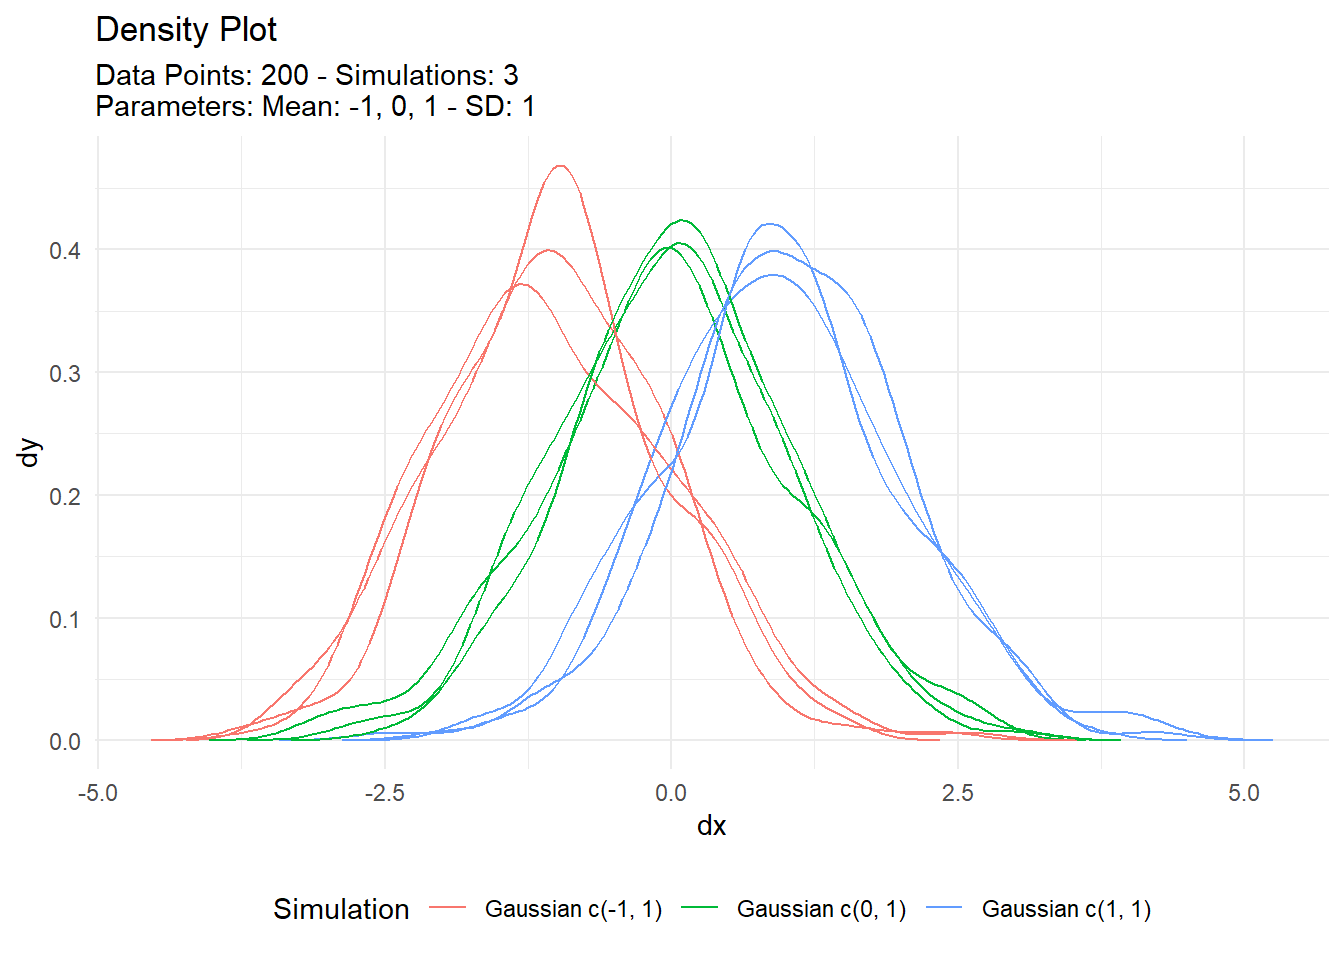
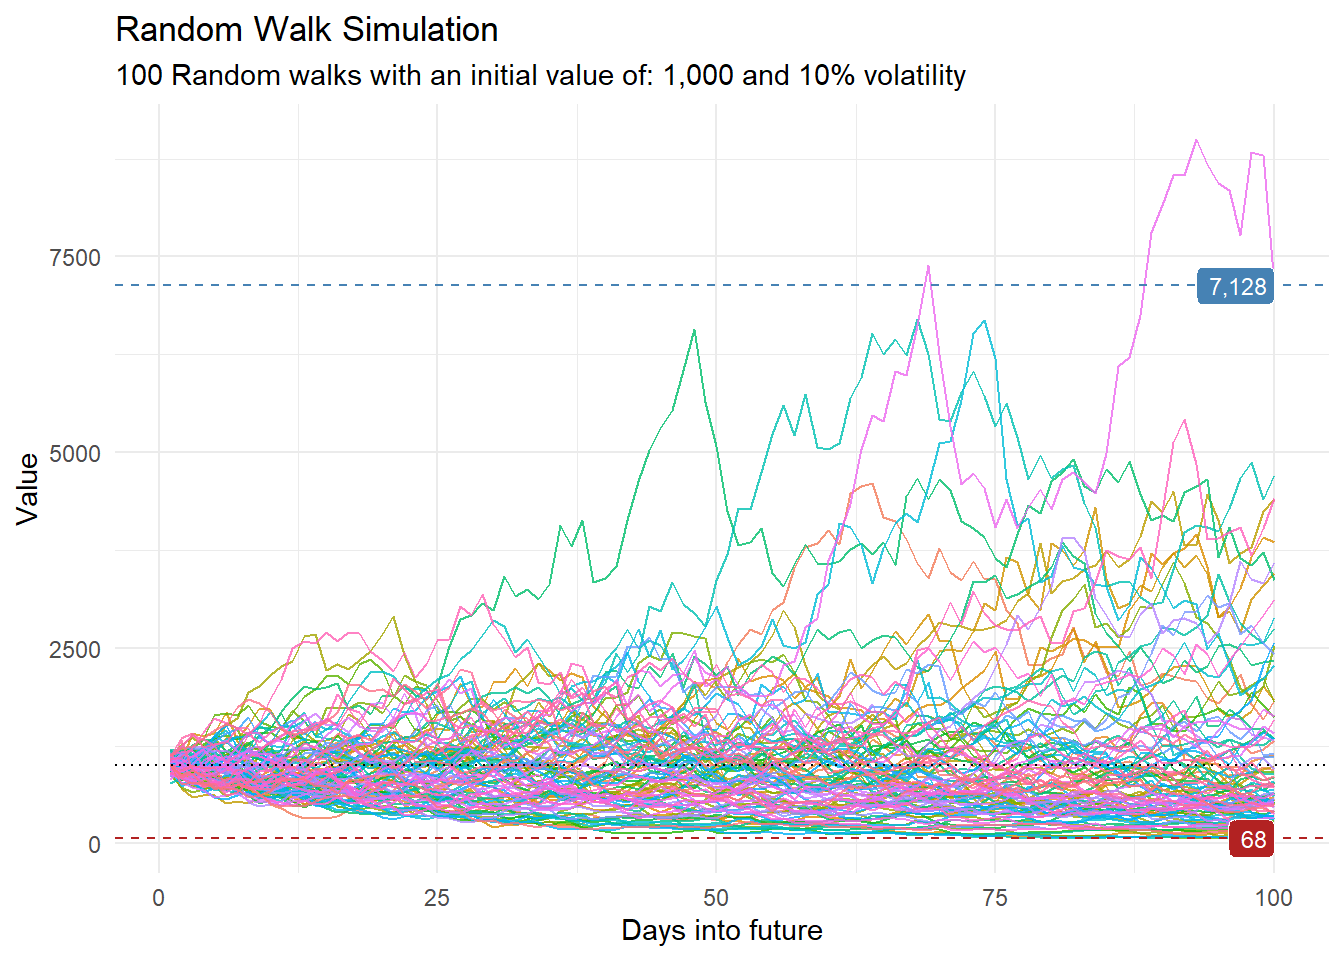
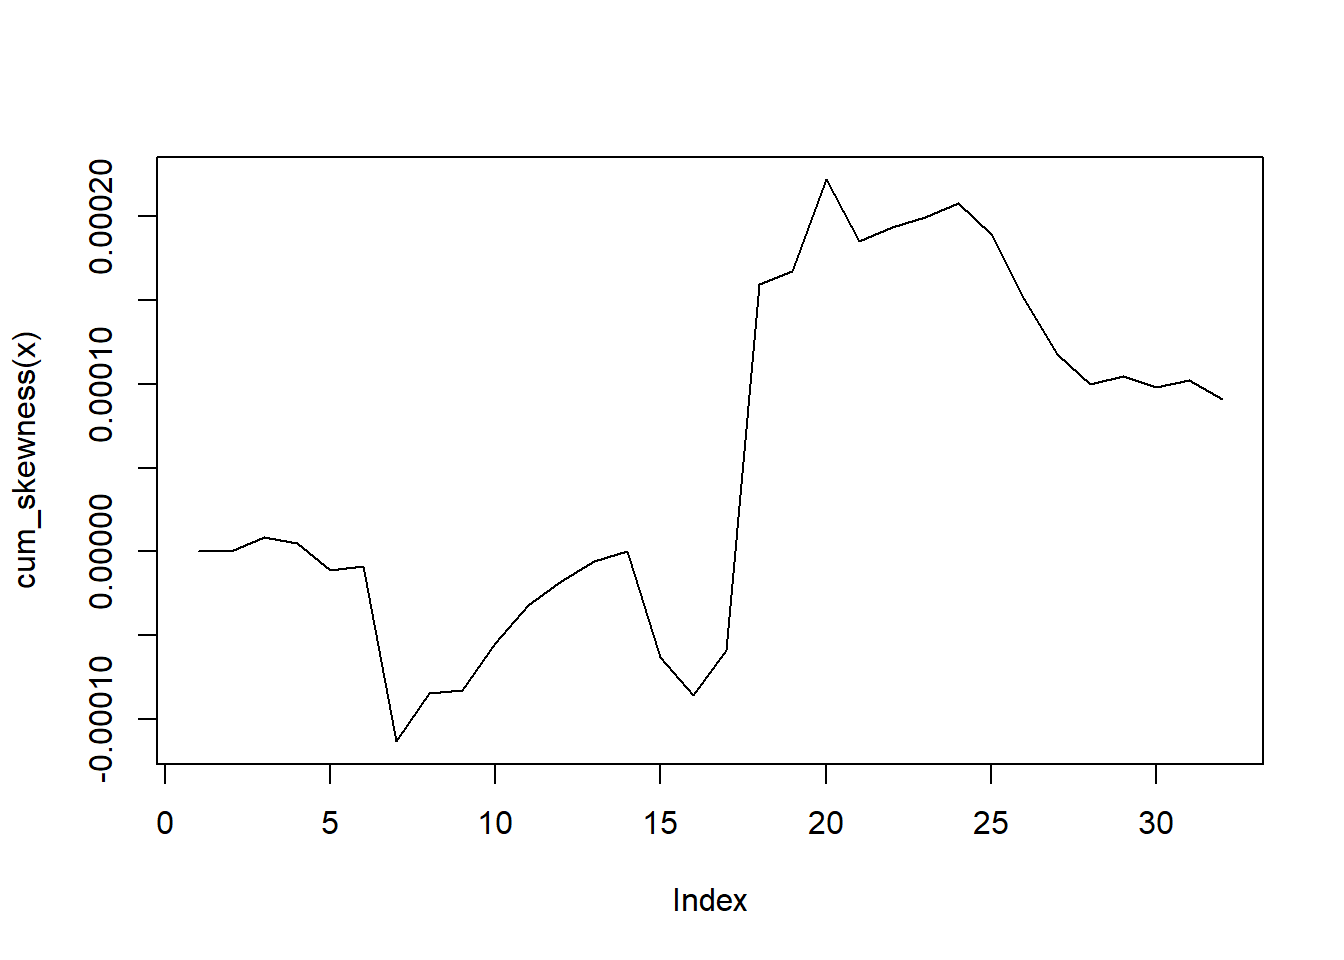
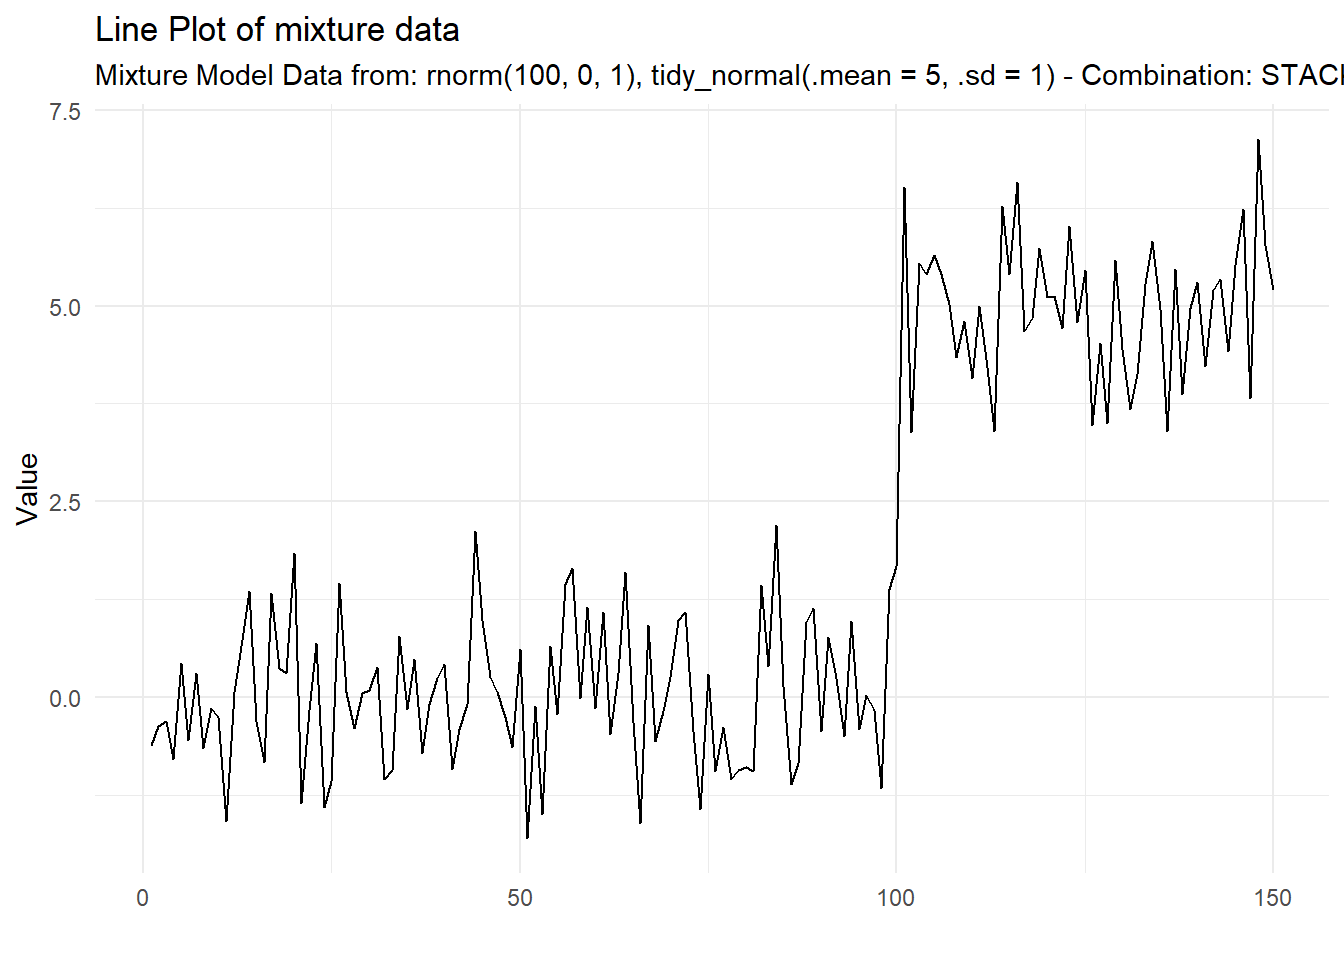
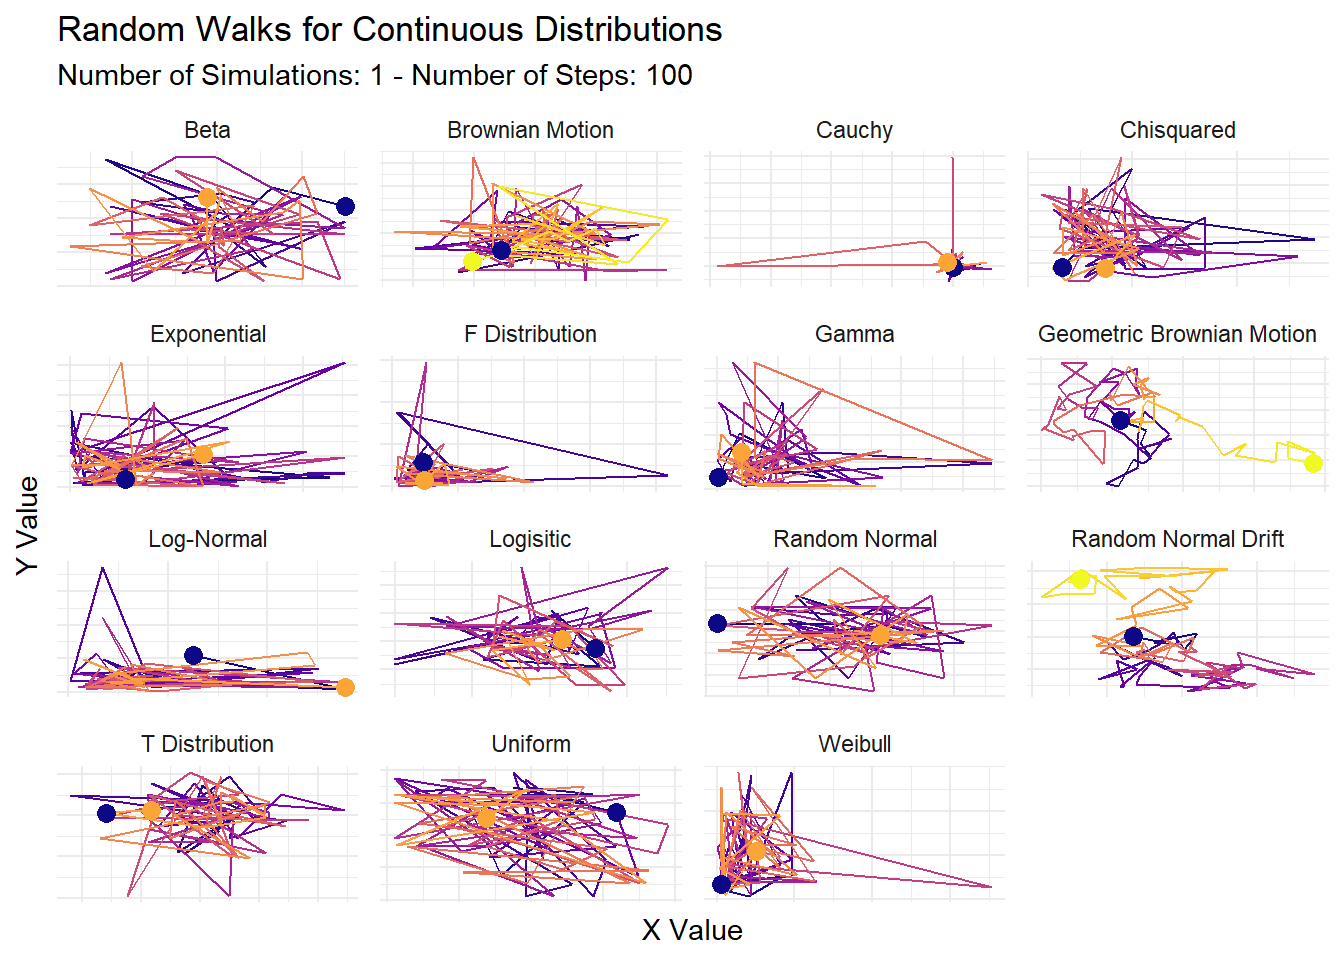
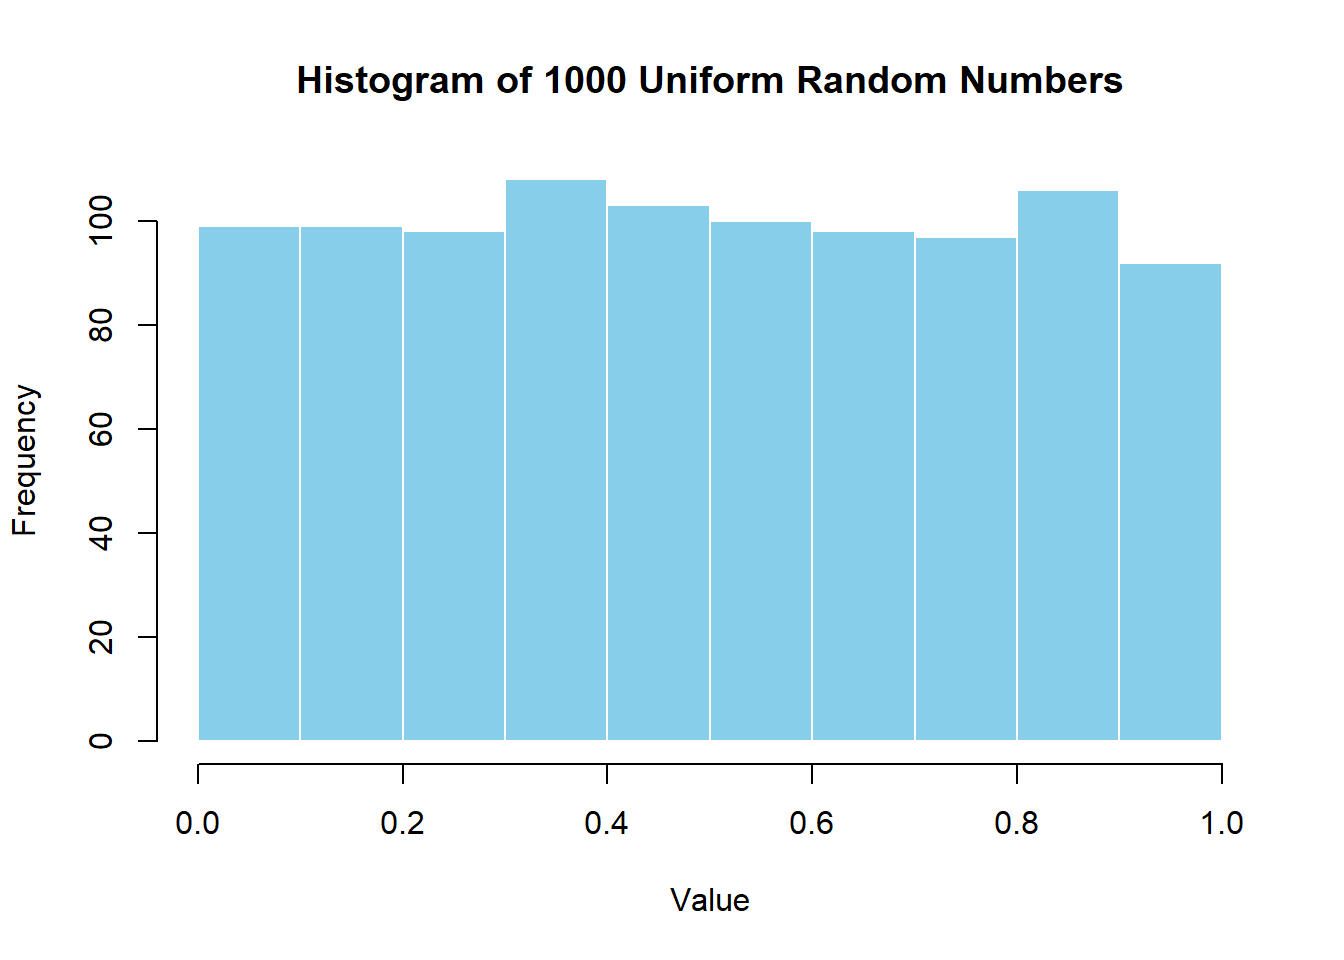
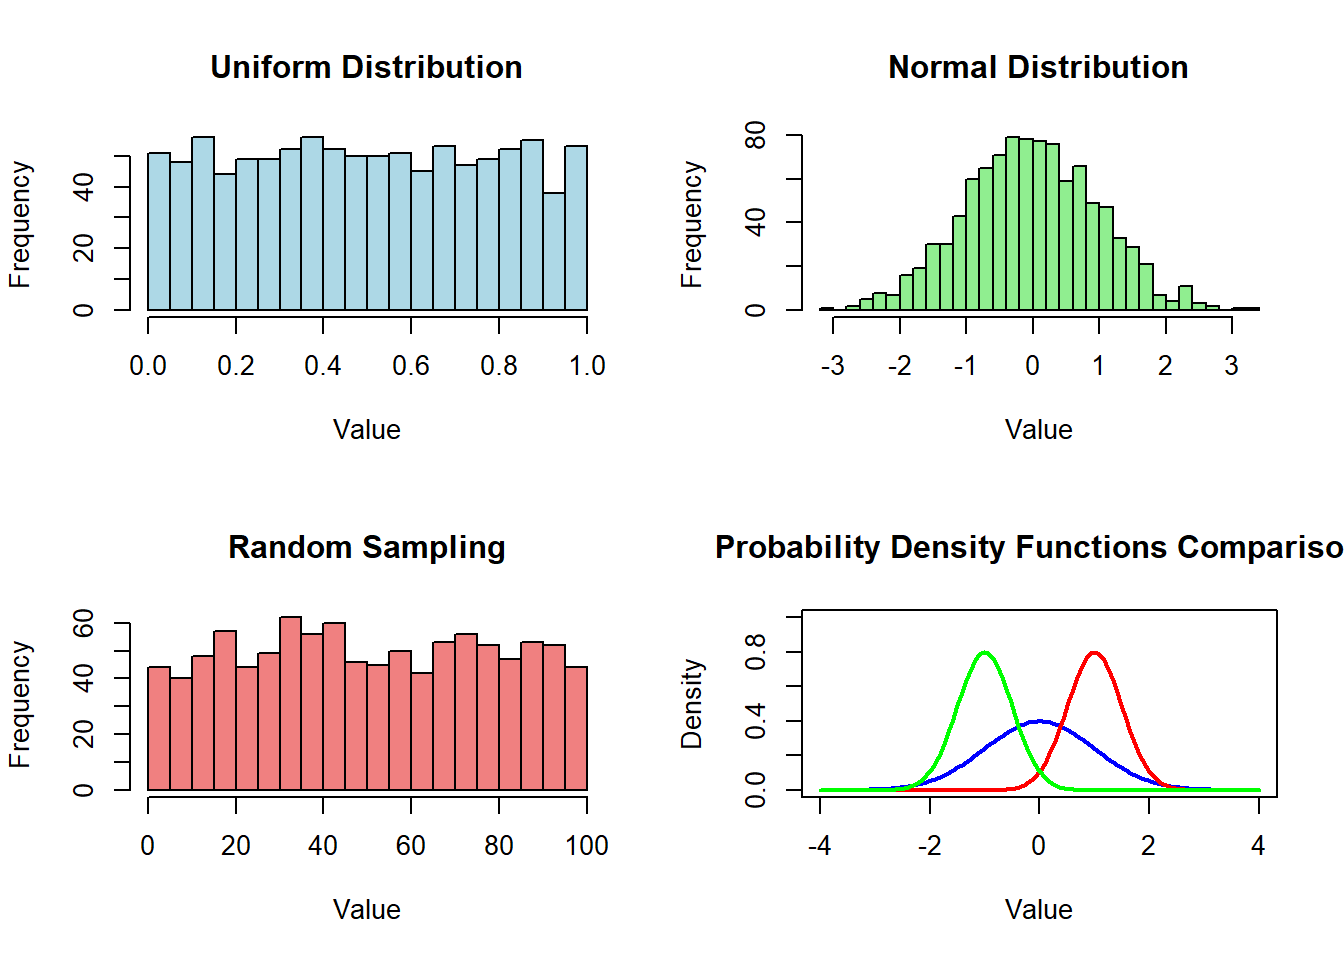
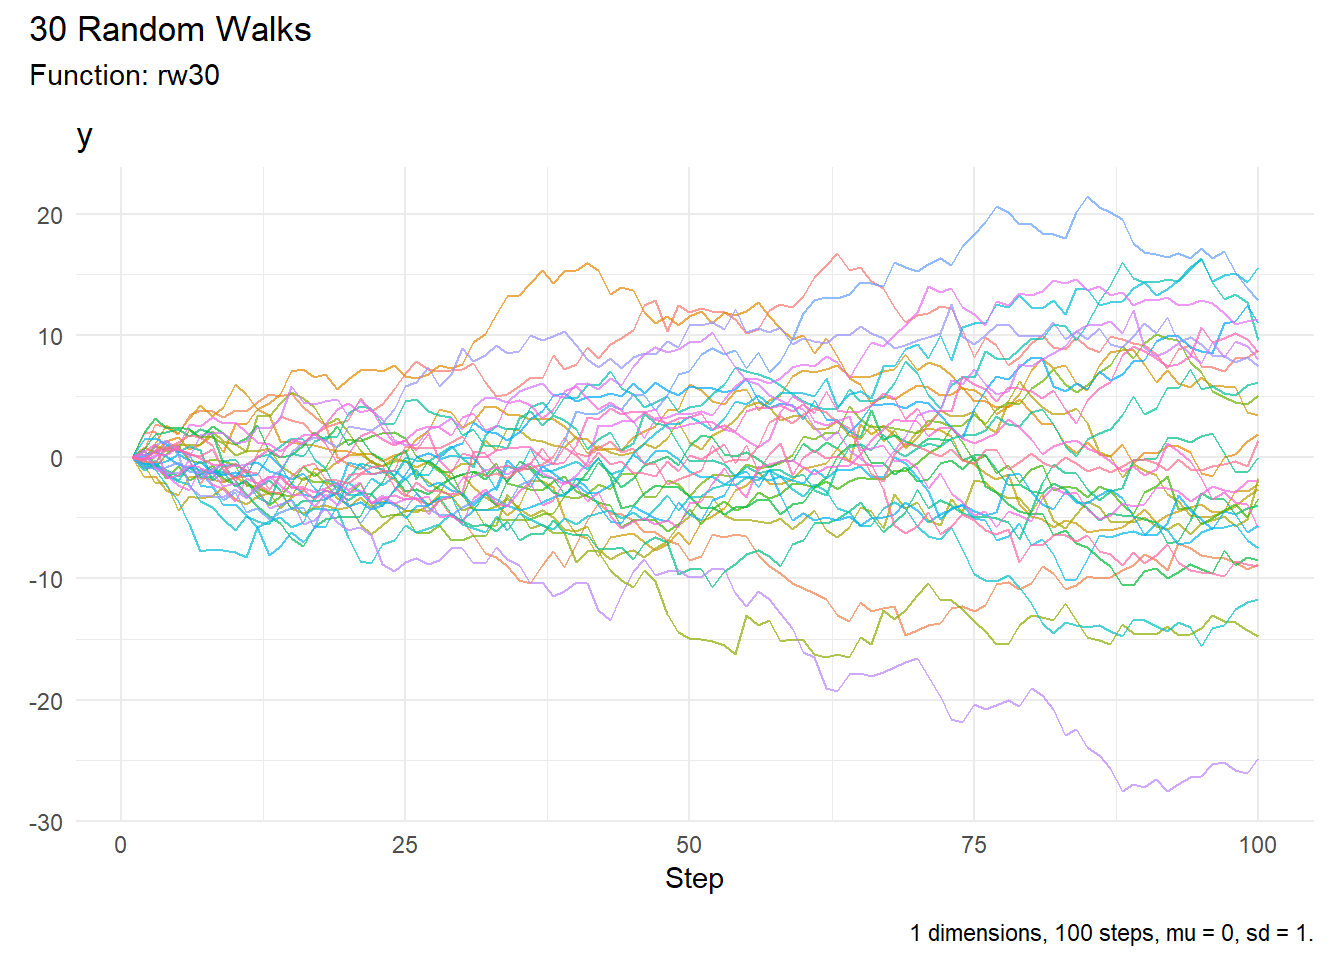
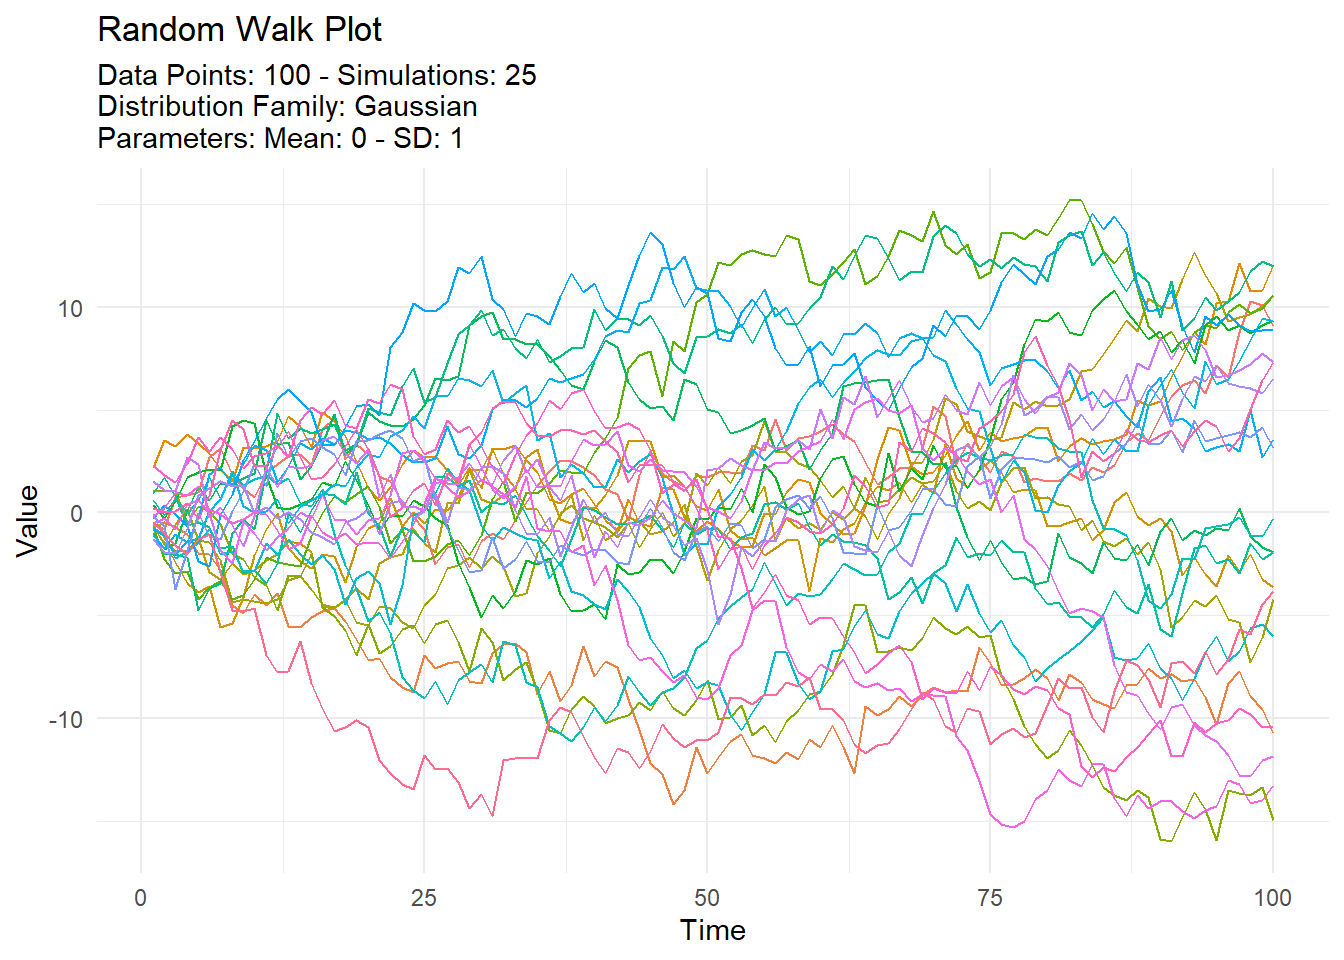
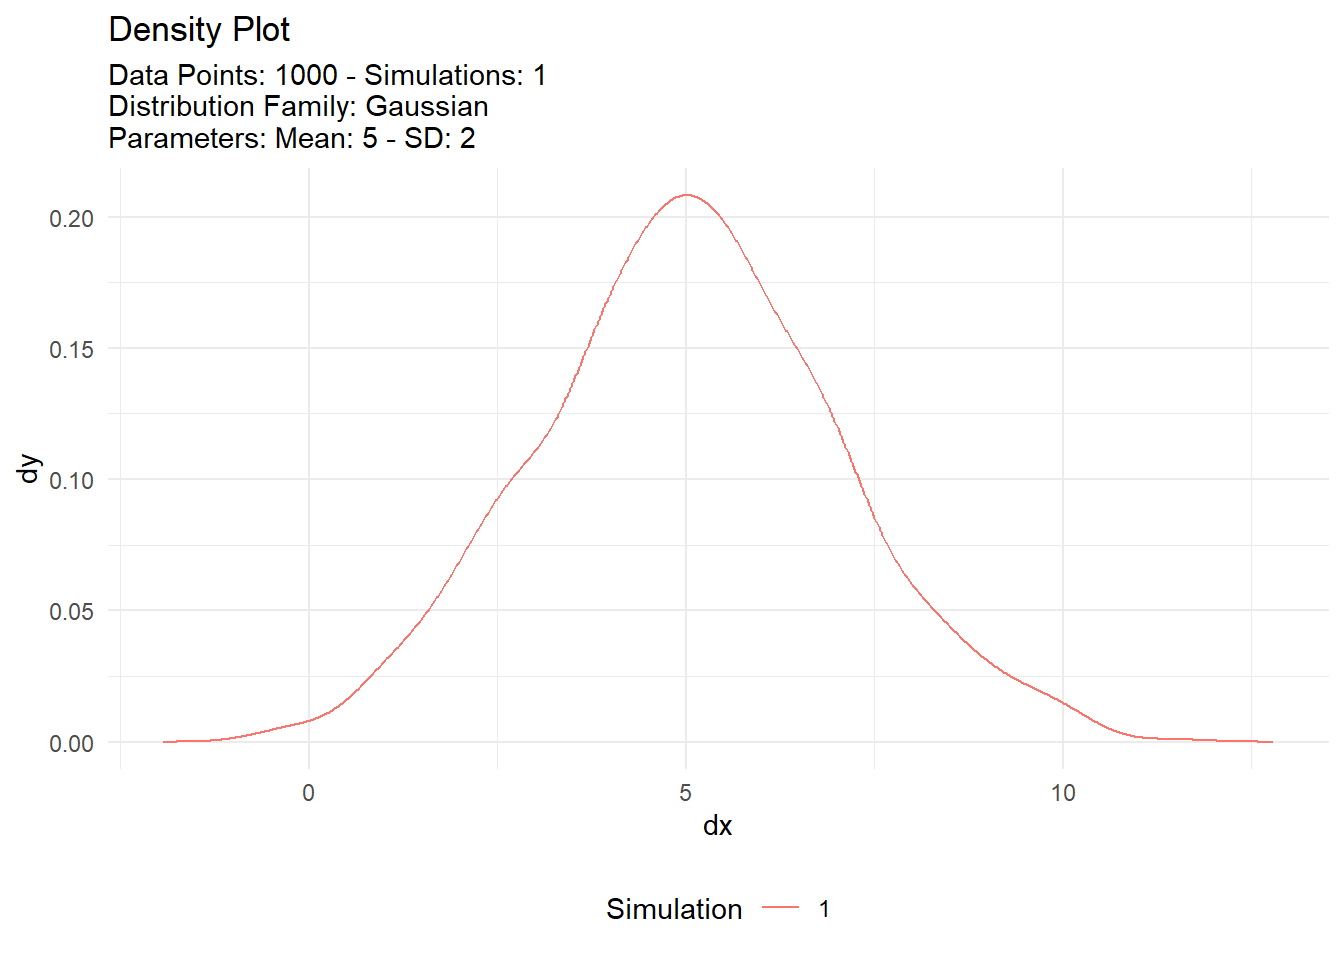
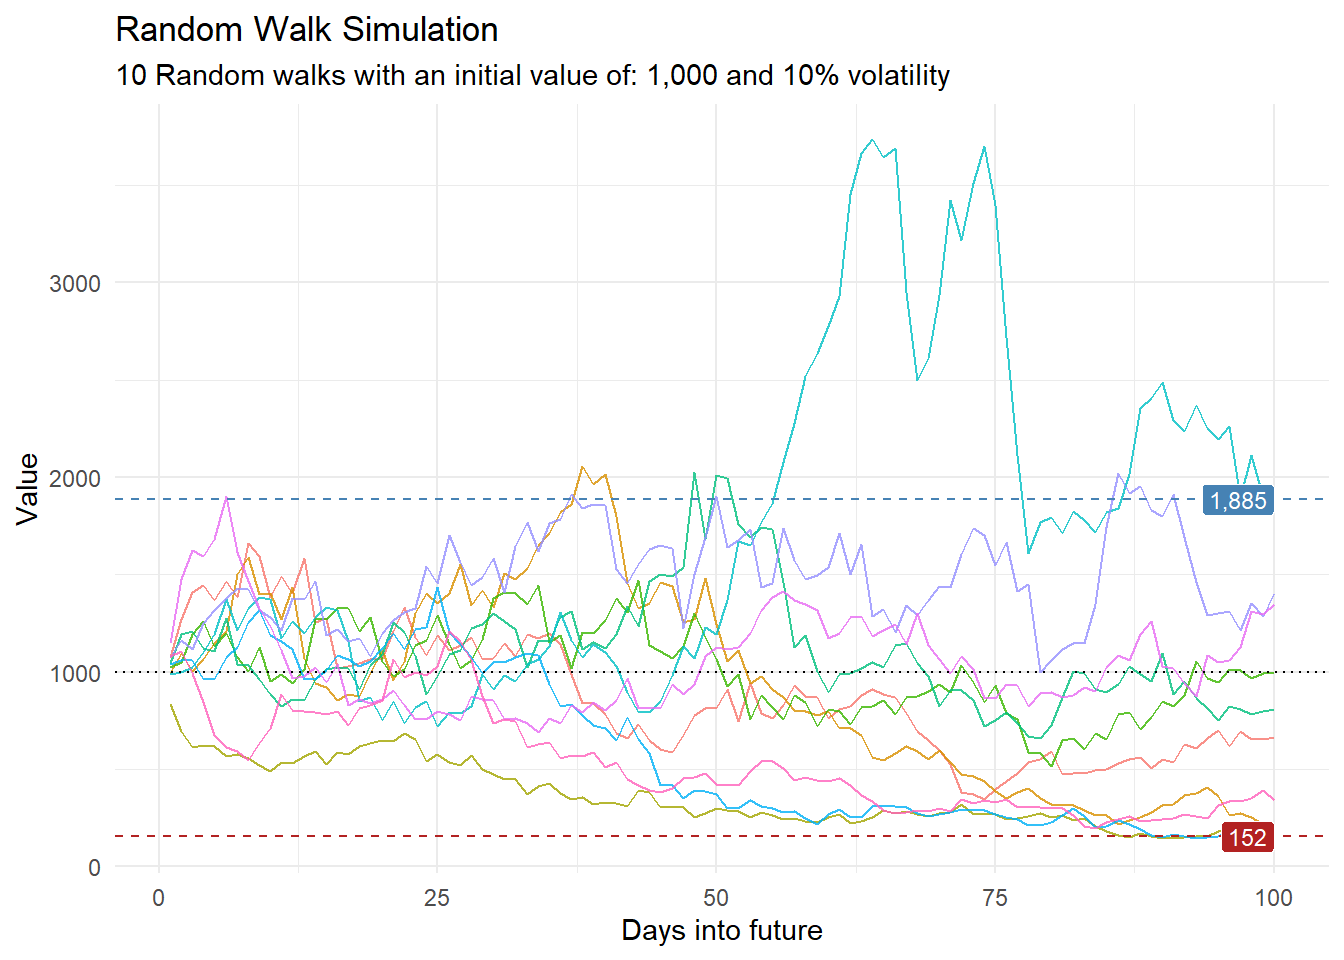
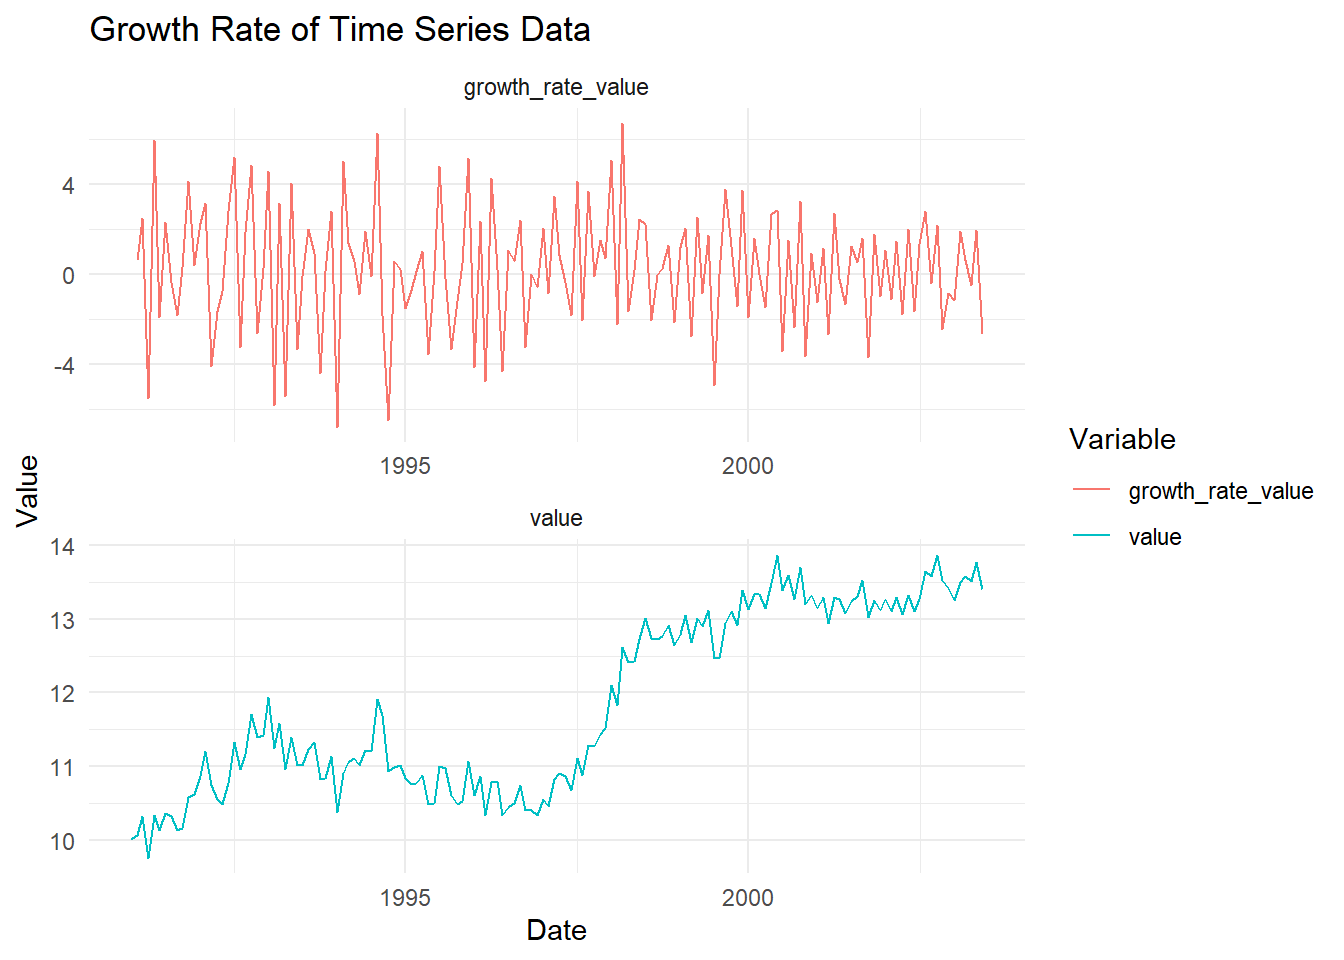
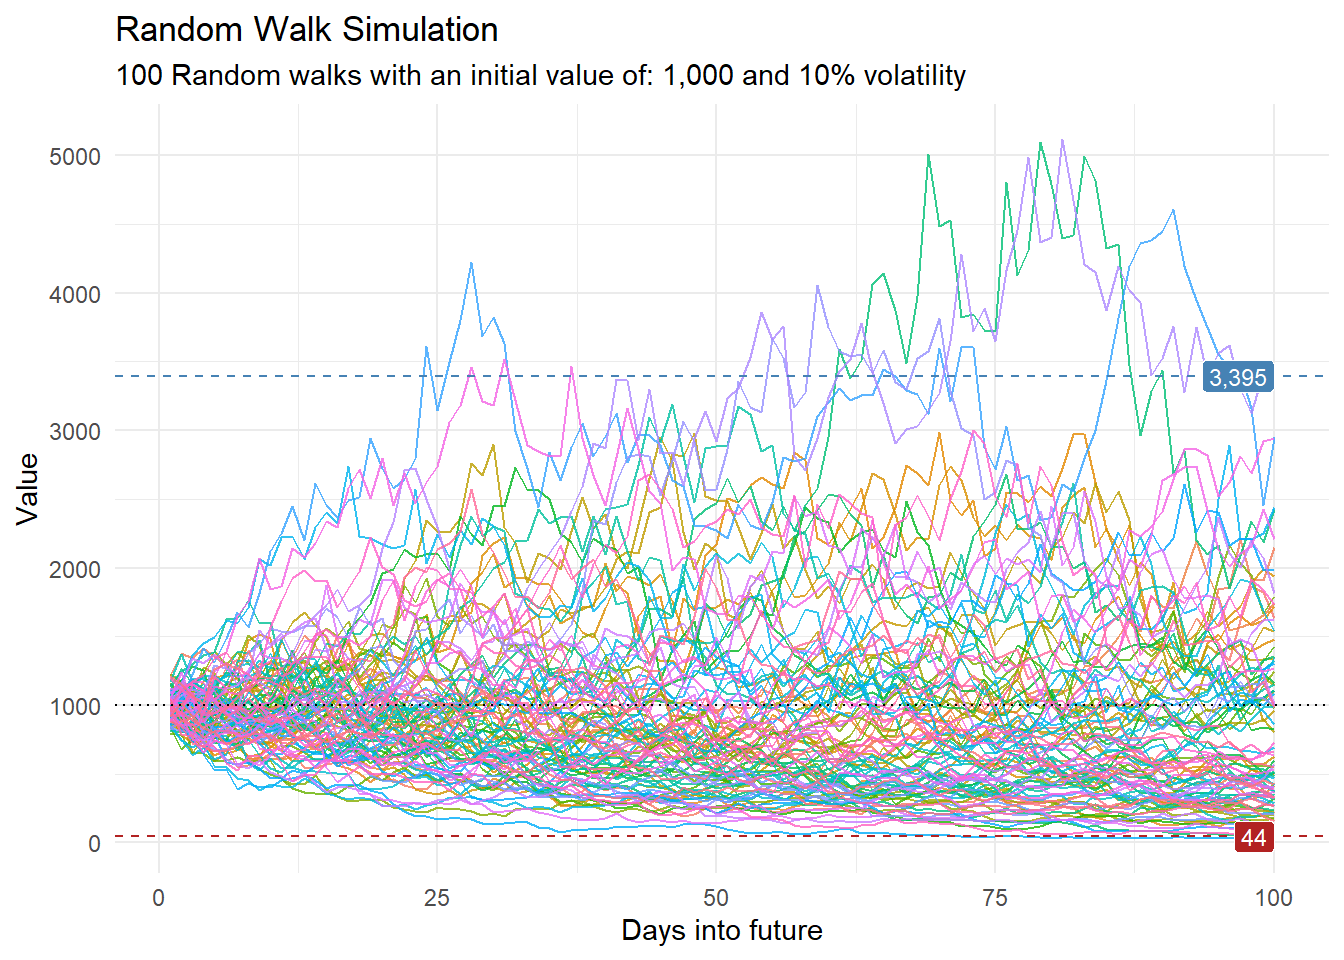
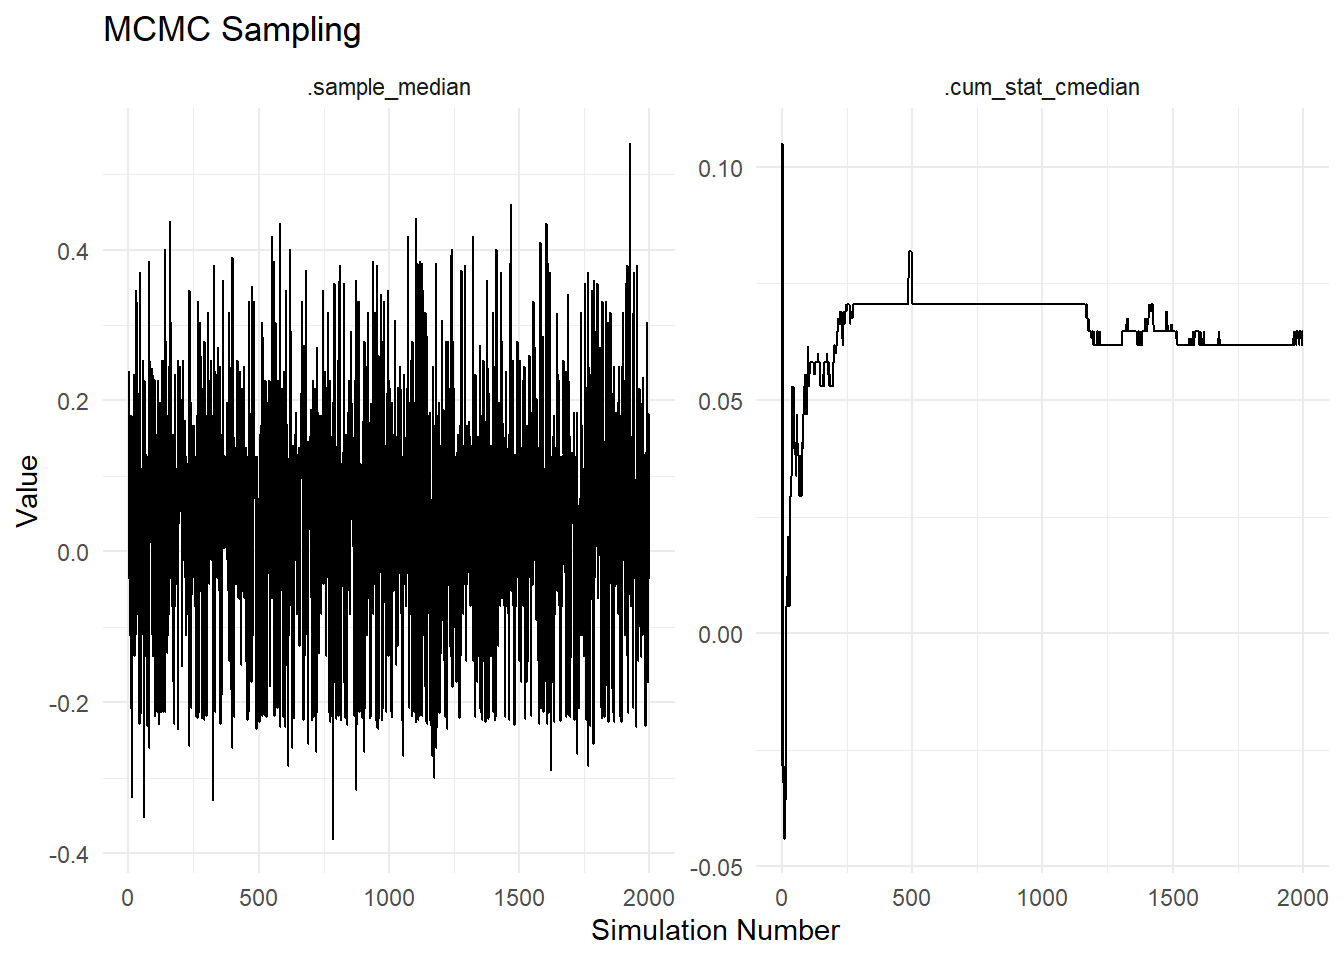
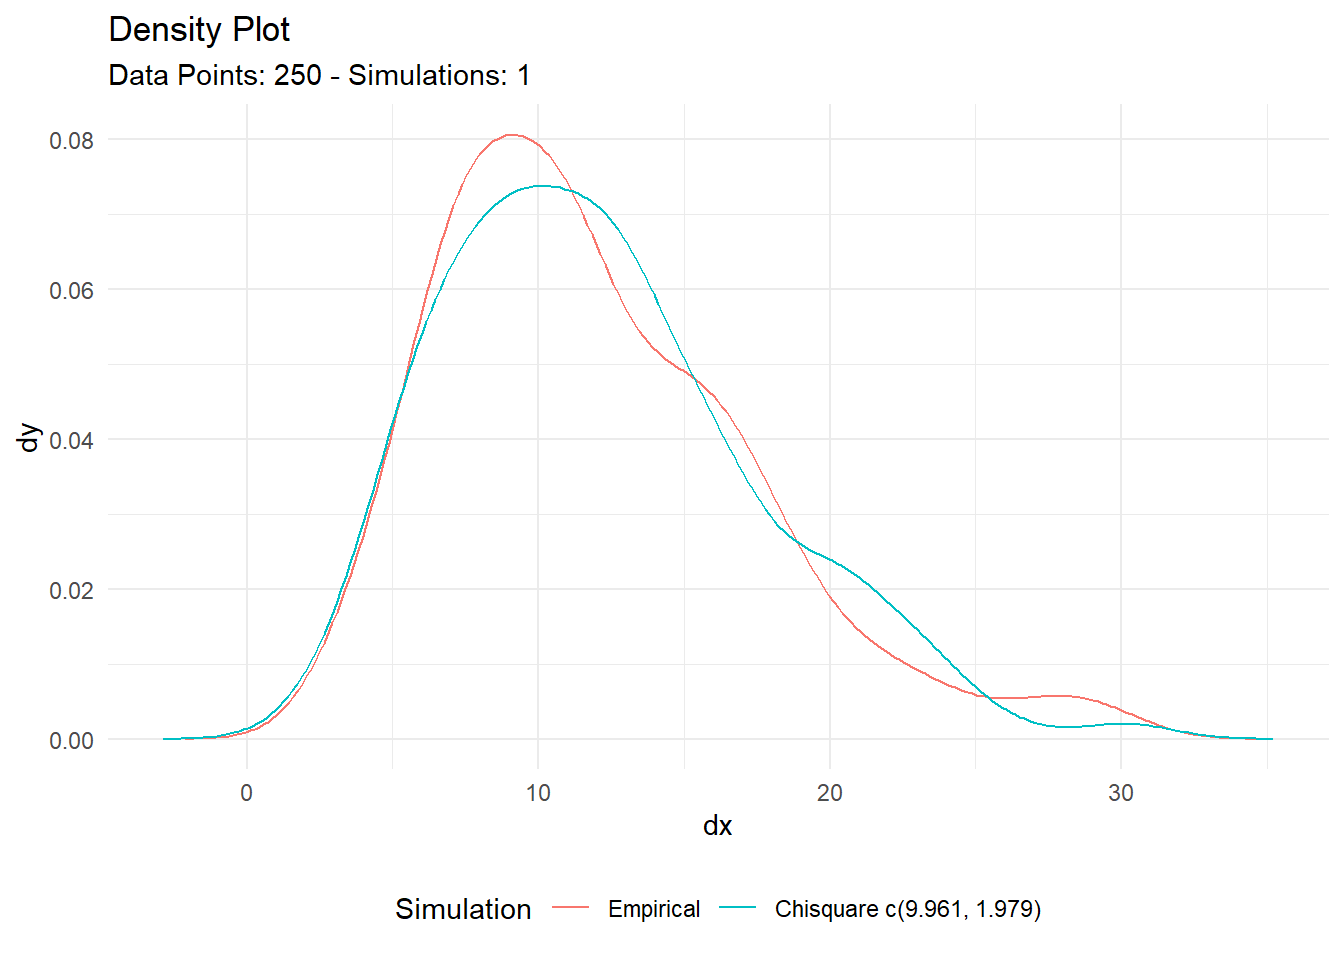
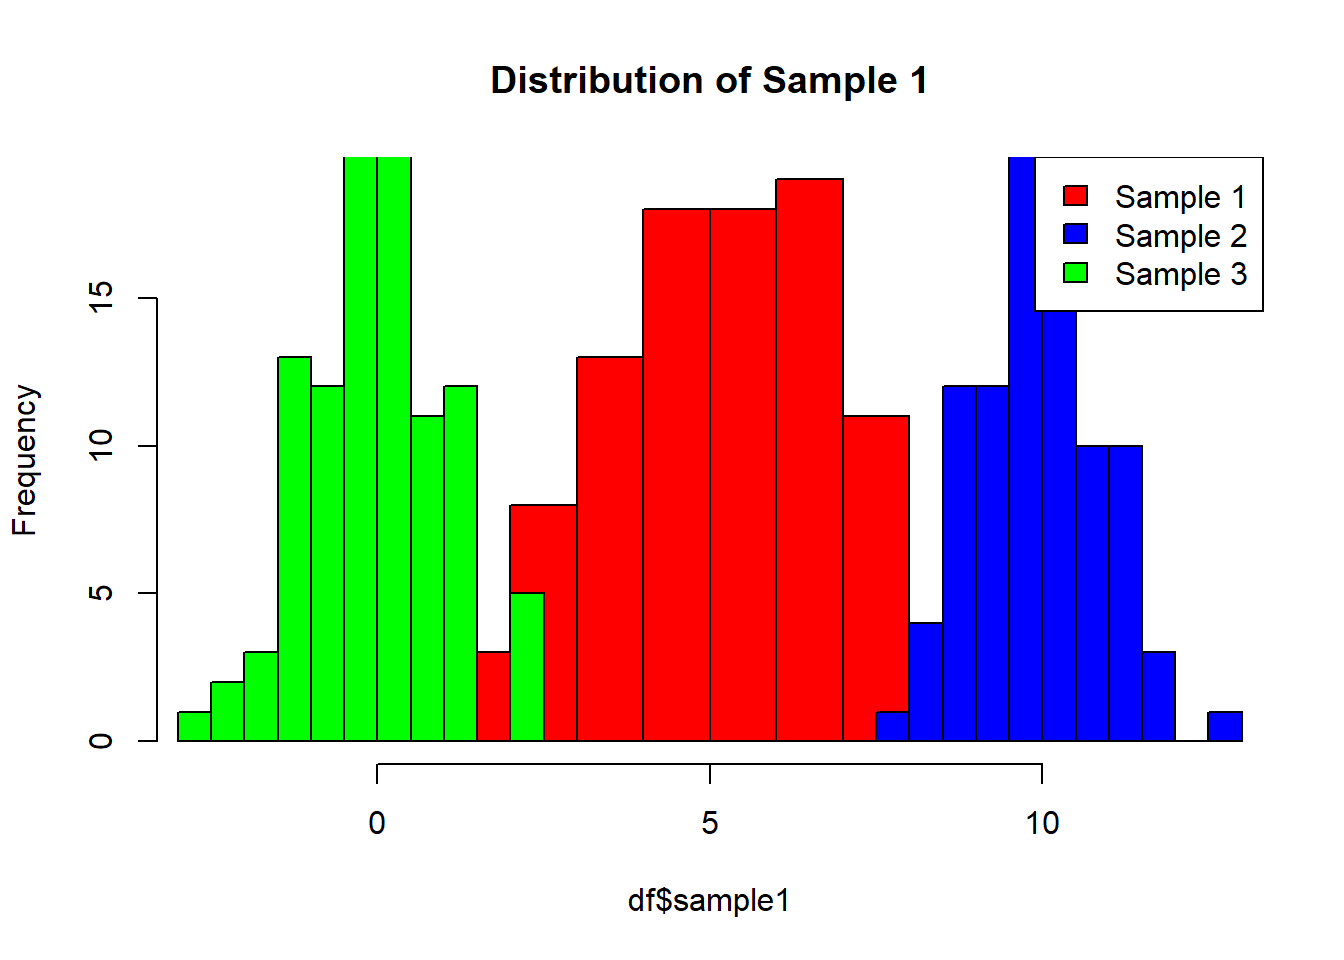
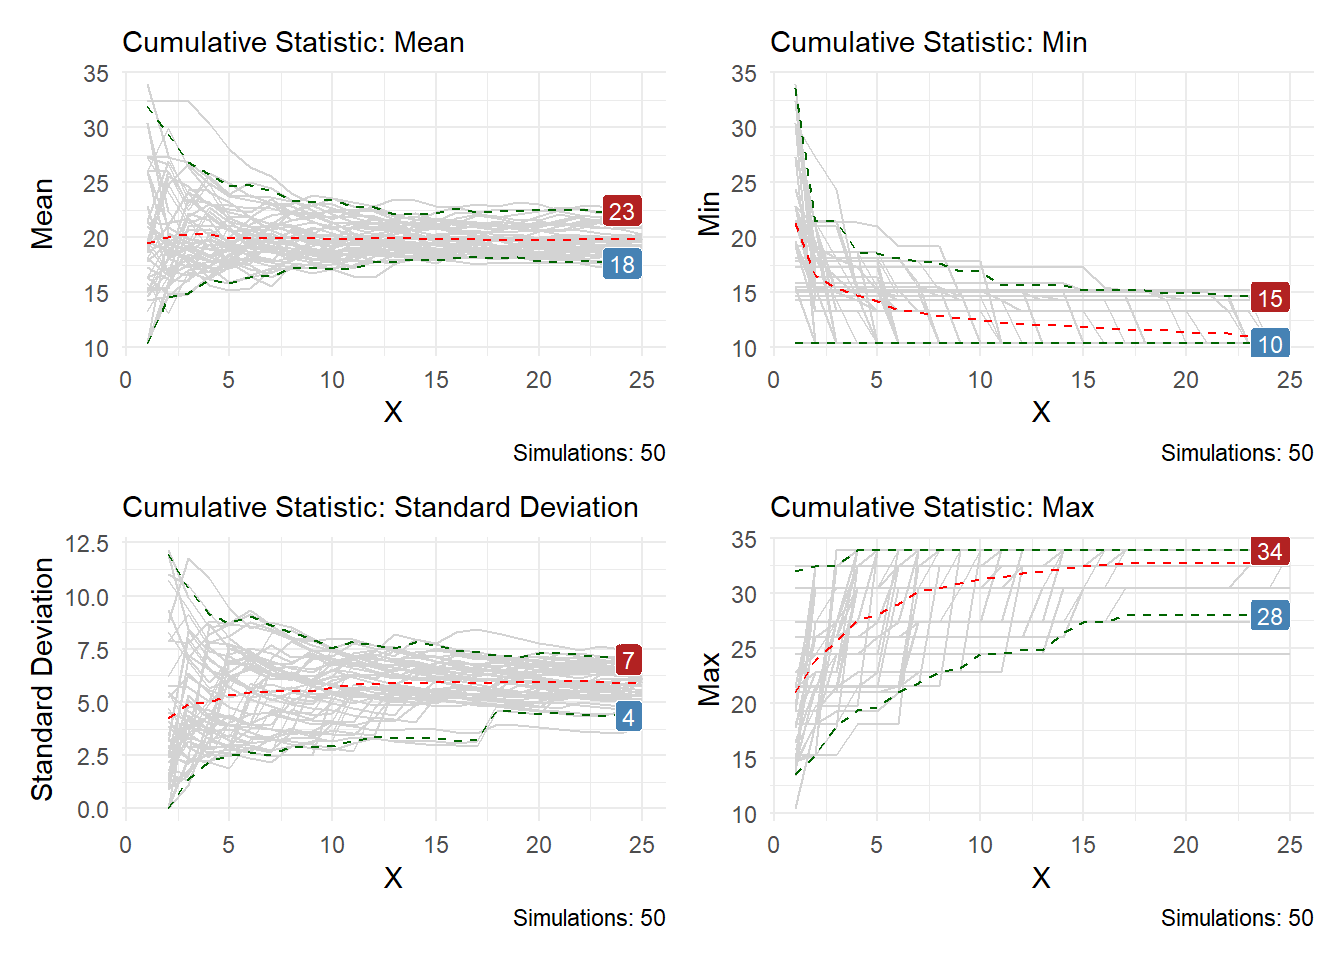
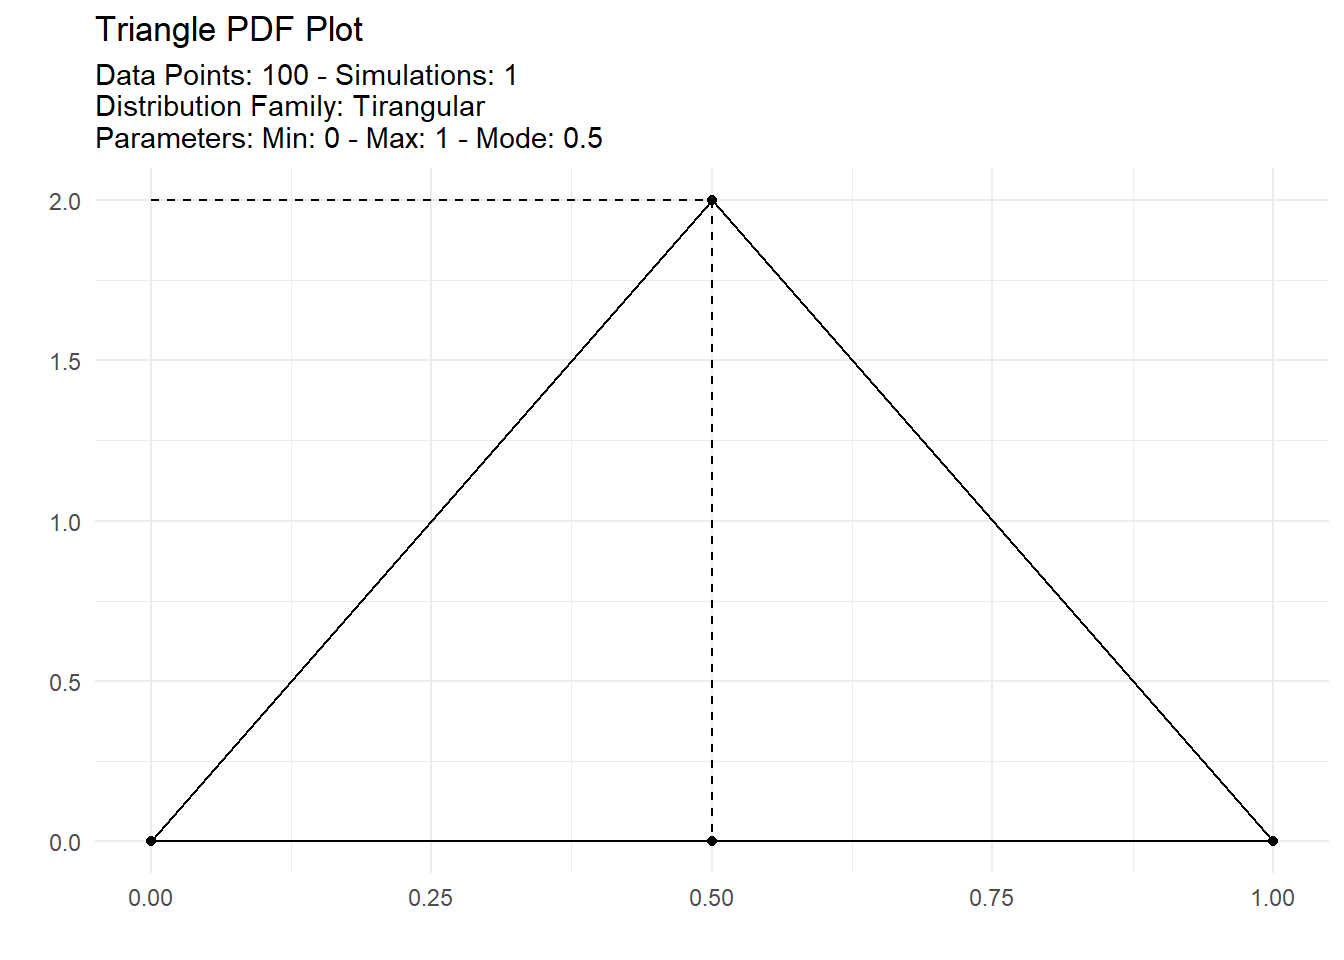
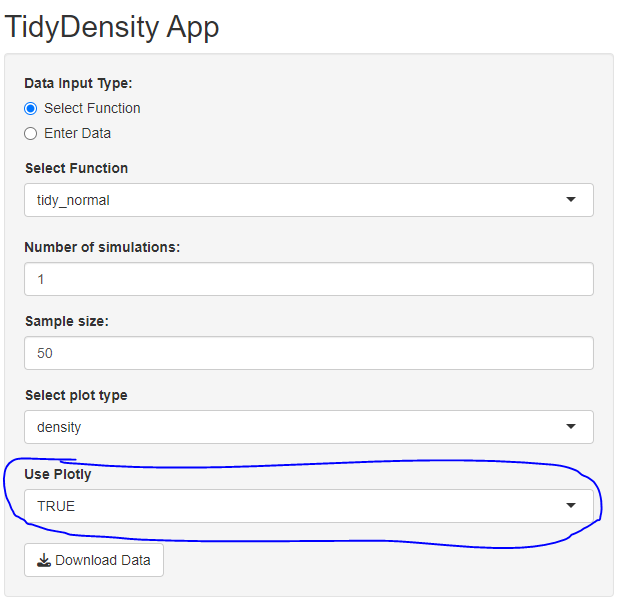
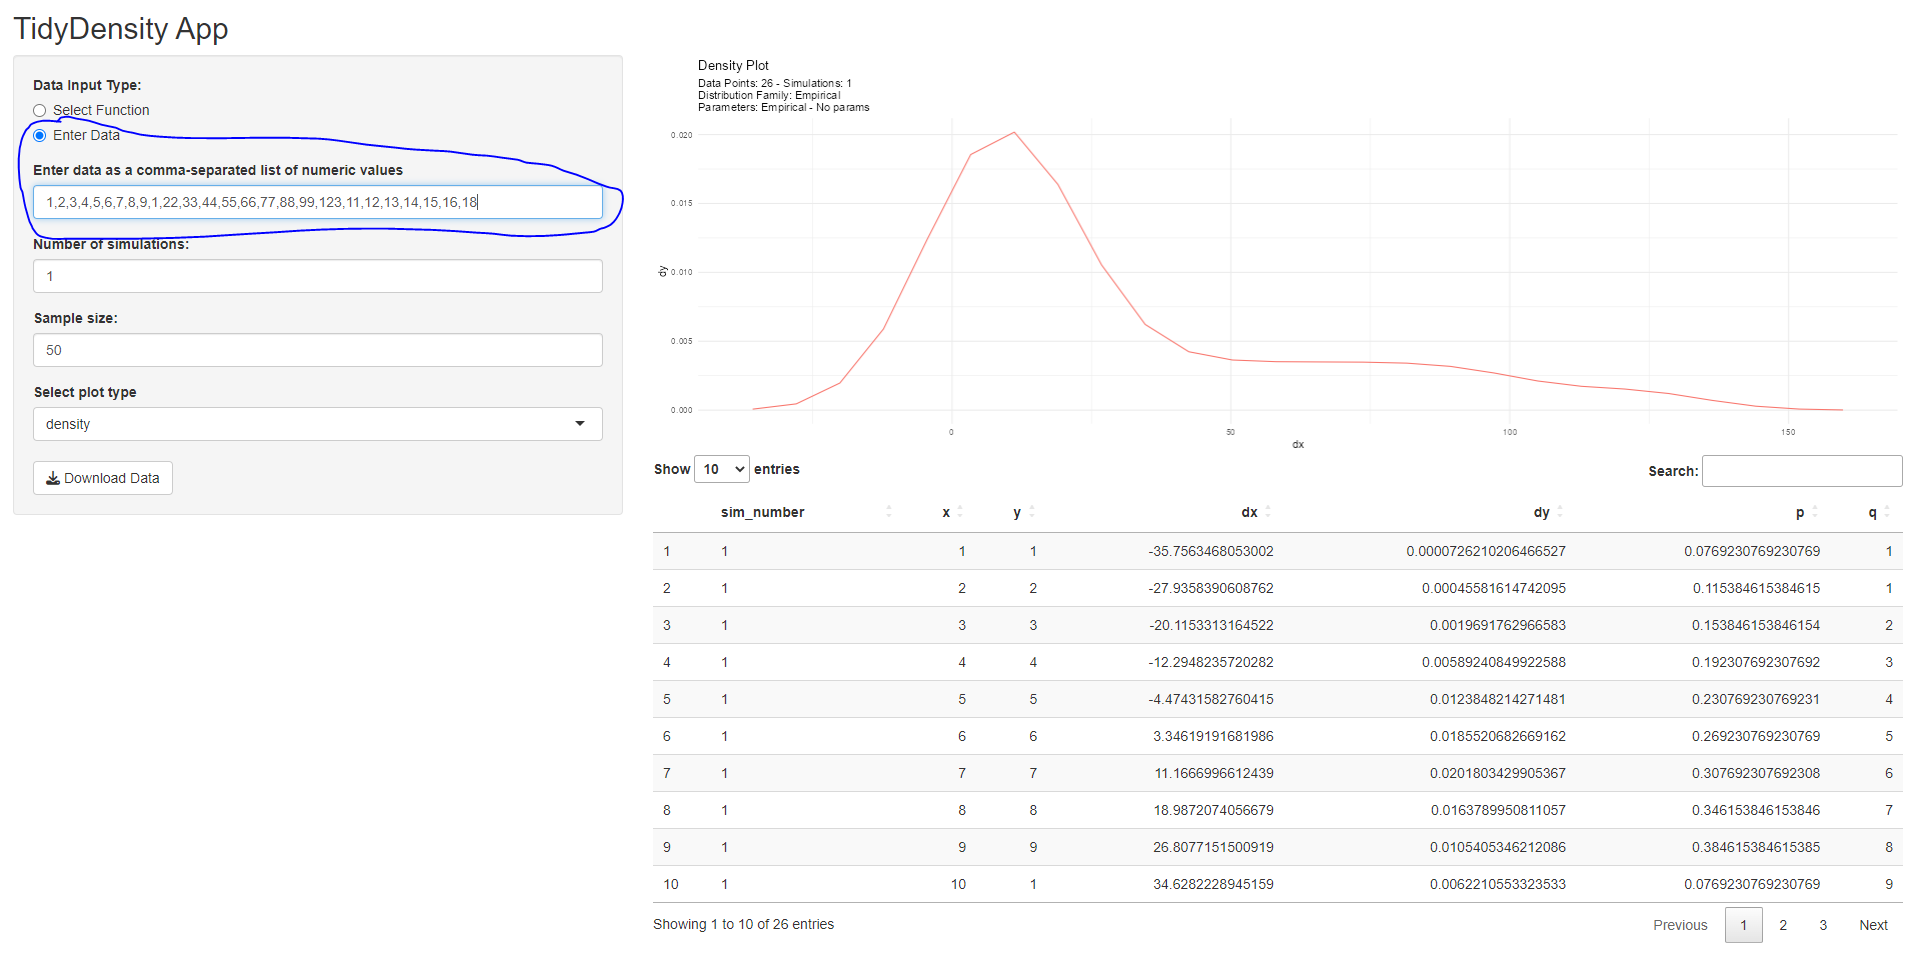
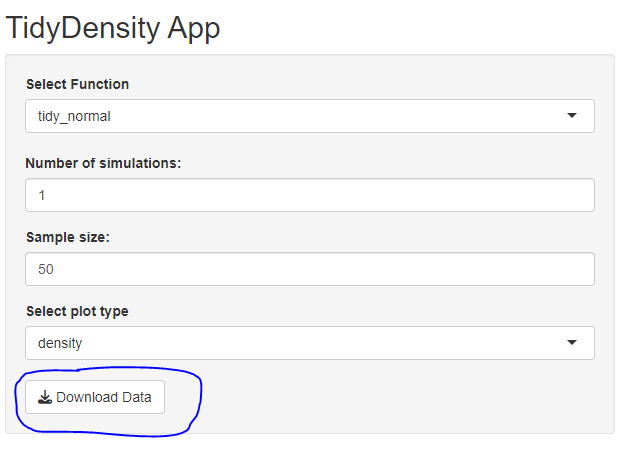
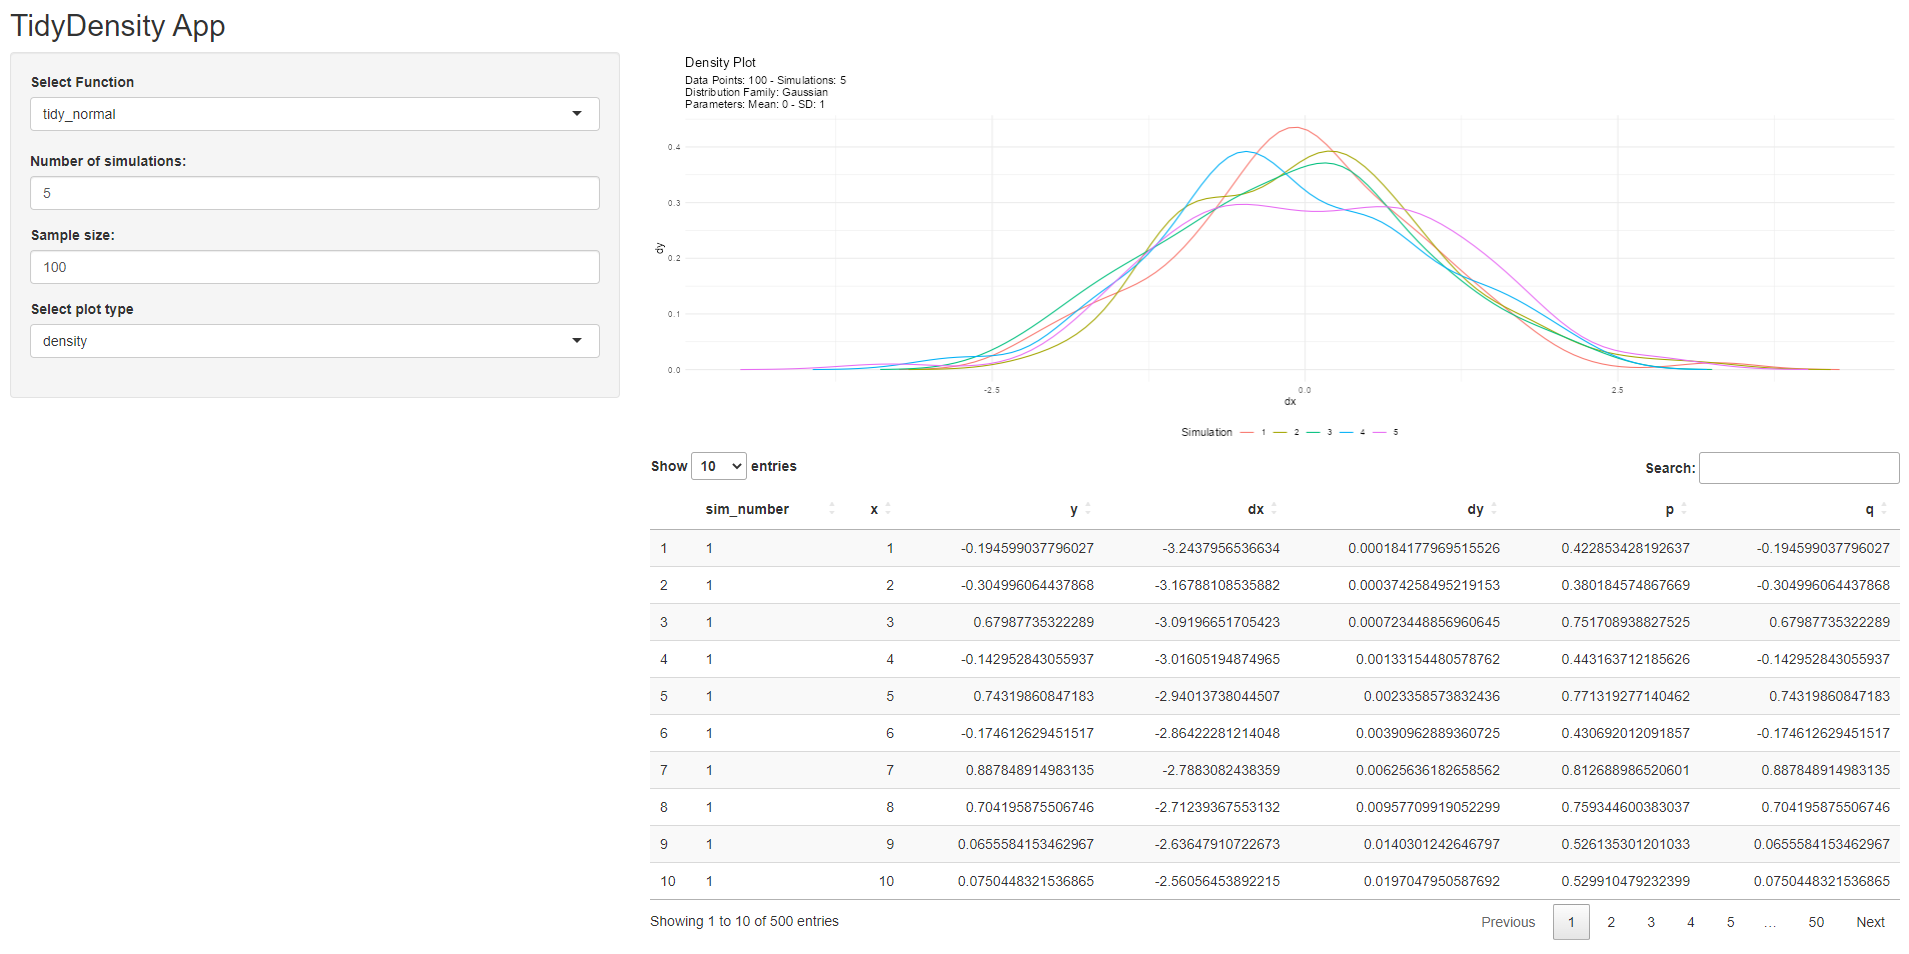
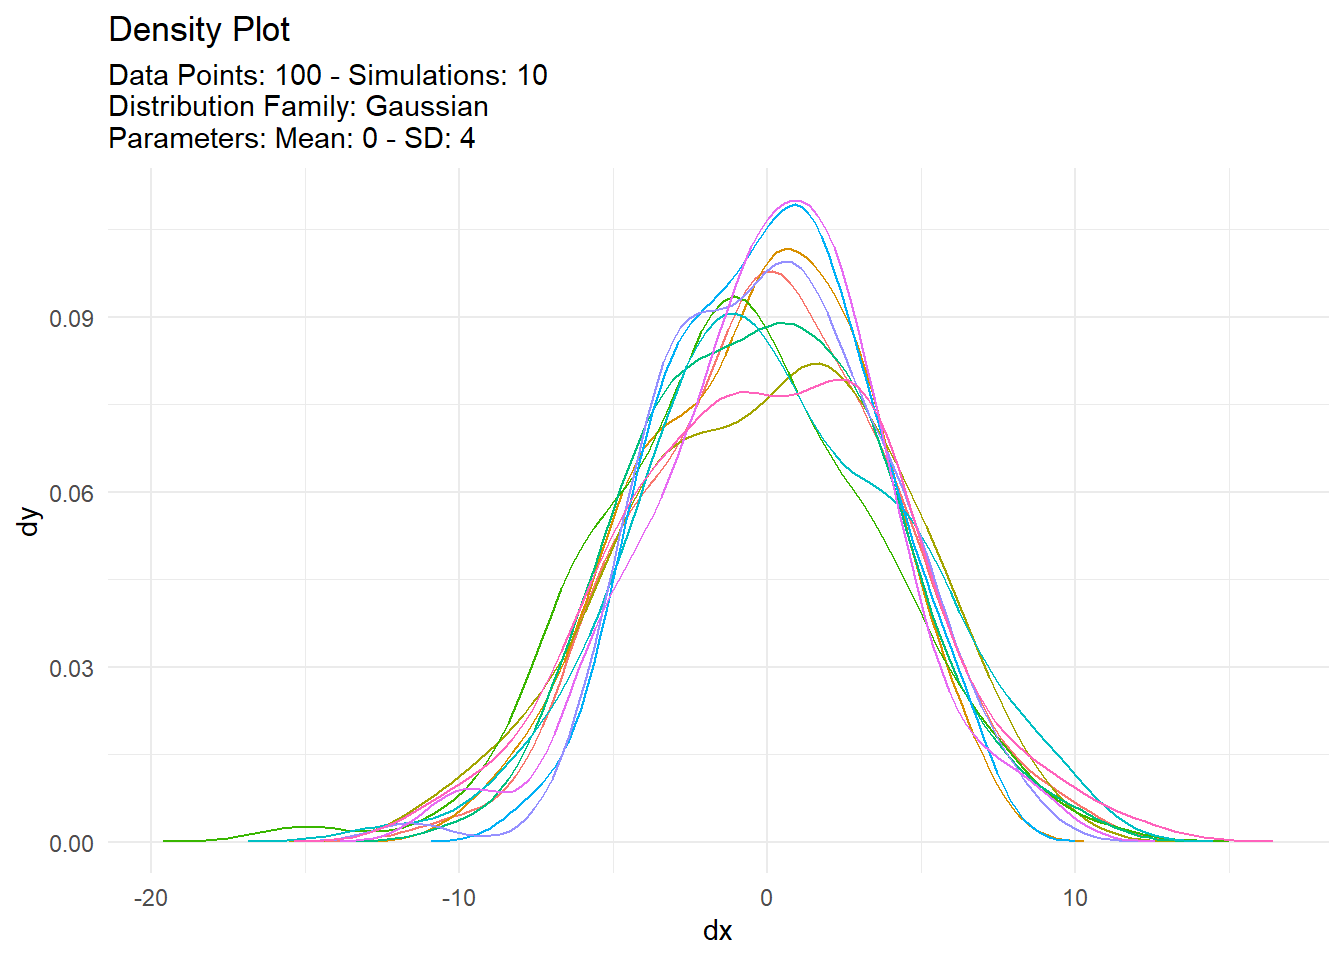
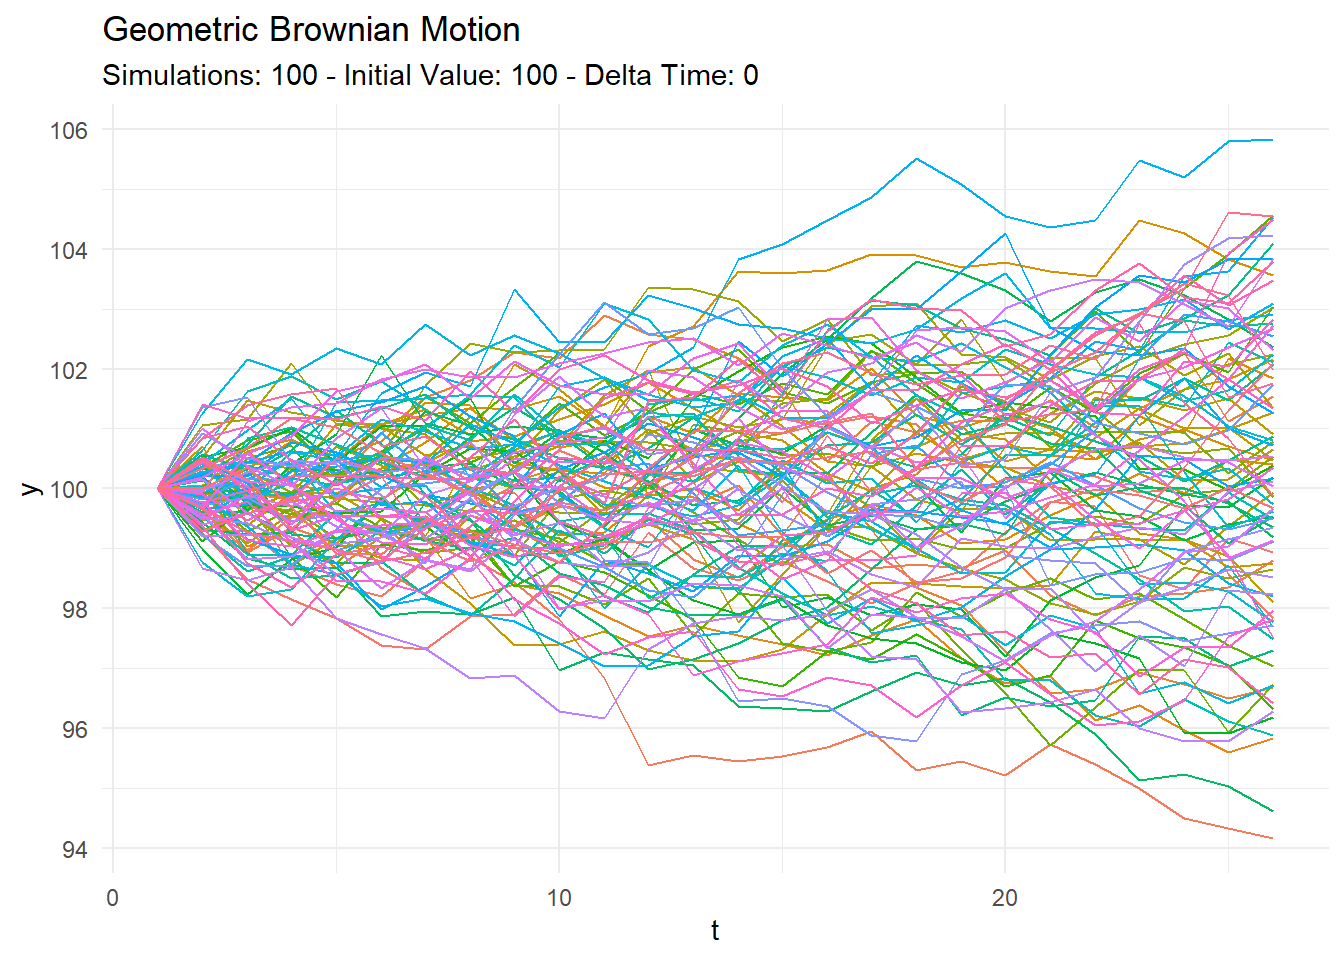
TidyDensity Primer
code
weeklytip
tidydensity
No matching items