How to Reorder Boxplots in R: A Comprehensive Guide
rtip
viz
Author
Steven P. Sanderson II, MPH
Published
September 28, 2023
Introduction
Boxplots are a great way to visualize the distribution of a dataset. However, sometimes the default ordering of boxplots may not be ideal for the data being presented. In this blog post, we will explore how to reorder boxplots in R using base R. We will provide at least three examples and explain them in simple terms. We encourage readers to try things on their own.
Examples
Example 1: Reorder Based on Specific Order
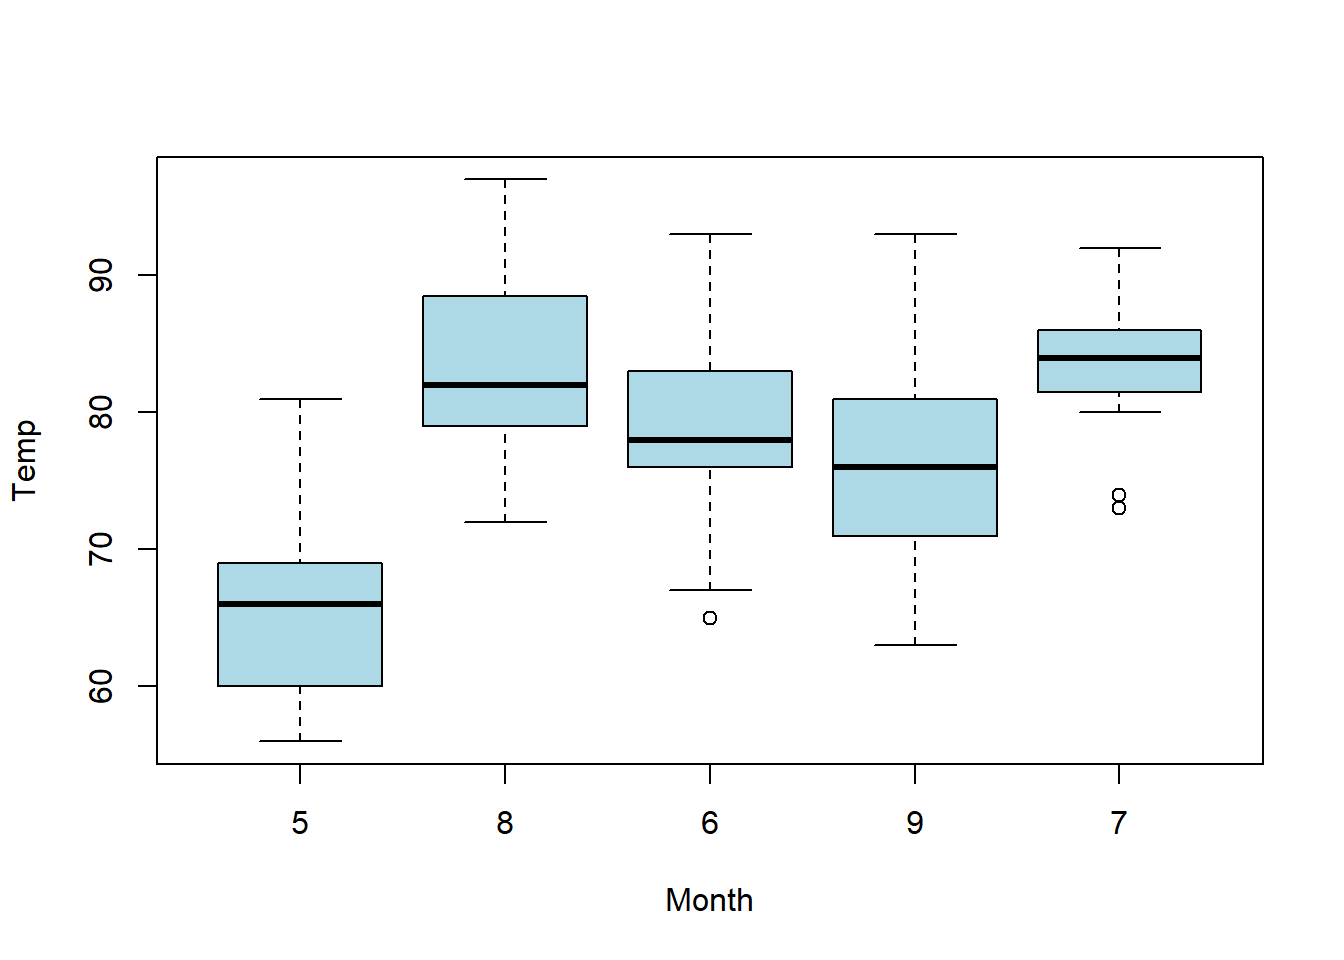
The first example shows how to order the boxplots based on a specific order for the variable being plotted. We will use the built-in airquality dataset in R. The following code shows how to order the boxplots based on the following order for the Month variable: 5, 8, 6, 9, 7.
# Load the airquality datasetdata(airquality)# Reorder Month valuesairquality$Month <-factor(airquality$Month, levels=c(5, 8, 6, 9, 7))# Create boxplot of temperatures by month using the order we specifiedboxplot(Temp ~ Month, data=airquality, col="lightblue", border="black")
Notice that the boxplots now appear in the order that we specified using the levels argument.
Example 2: Reorder Based on Median Value
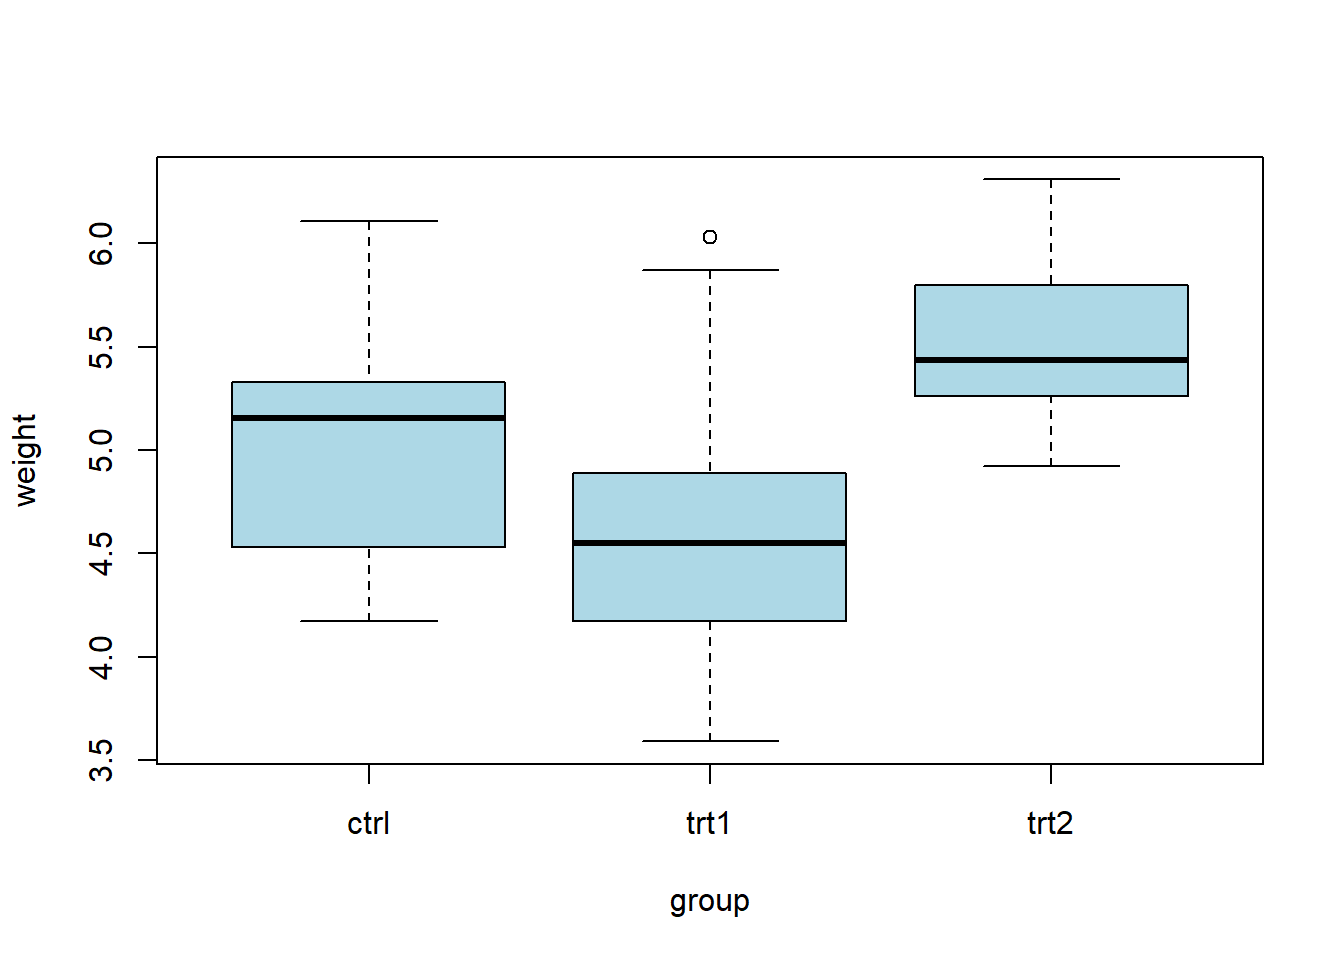
The second example shows how to order the boxplots in ascending order based on the median value for each group. We will use the built-in PlantGrowth dataset in R.
# Load the PlantGrowth datasetdata(PlantGrowth)# Create boxplot of weight by groupboxplot(weight ~ group, data=PlantGrowth, col="lightblue", border="black")
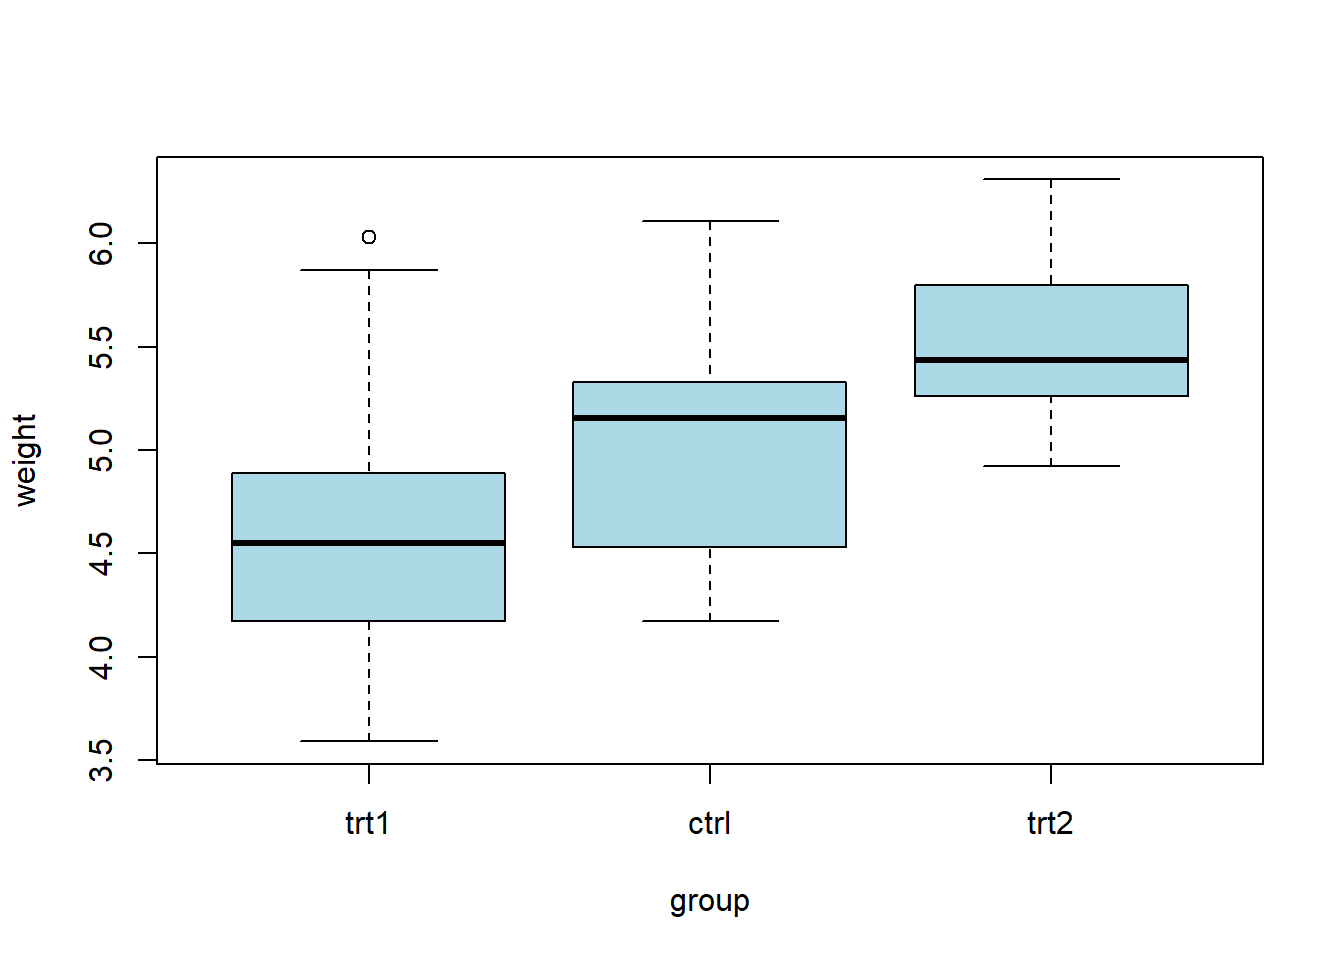
# Reorder the groups based on median weightgroup_order <-names(sort(tapply(PlantGrowth$weight, PlantGrowth$group, median)))PlantGrowth$group <-factor(PlantGrowth$group, levels=group_order)# Create boxplot of weight by group using the new orderboxplot(weight ~ group, data=PlantGrowth, col="lightblue", border="black")
Notice that the boxplots now appear in ascending order based on the median weight for each group.
Example 3: Reorder Based on Custom Function
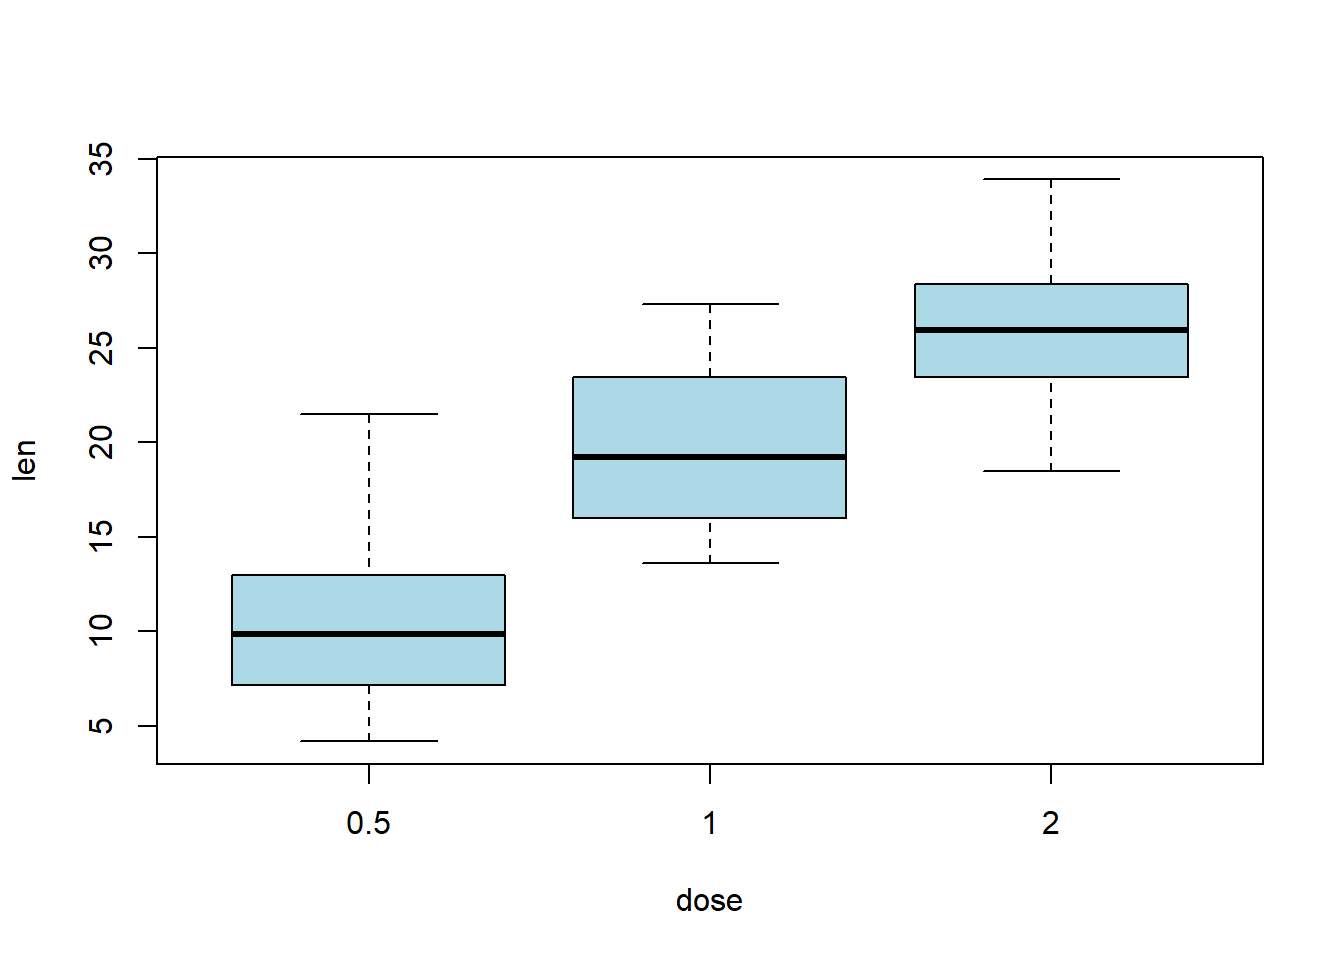
The third example shows how to order the boxplots based on a custom function. We will use the built-in ToothGrowth dataset in R.
# Load the ToothGrowth datasetdata(ToothGrowth)# Create boxplot of length by doseboxplot(len ~ dose, data=ToothGrowth, col="lightblue", border="black")# Reorder the groups based on the mean length multiplied by the dosegroup_order <-names(sort(tapply(ToothGrowth$len * ToothGrowth$dose, ToothGrowth$dose, mean)))ToothGrowth$dose <-factor(ToothGrowth$dose, levels=group_order)# Create boxplot of length by dose using the new orderboxplot(len ~ dose, data=ToothGrowth, col="lightblue", border="black")
Notice that the boxplots now appear in order based on the mean length multiplied by the dose for each group.
Conclusion
In conclusion, reordering boxplots in R is a simple and effective way to improve the visualization of your data. We have shown three examples of how to reorder boxplots in base R. We encourage readers to try these examples on their own and experiment with different datasets and custom functions.