# Sample data
set.seed(123)
data <- data.frame(
  x = rnorm(20),
  y = rnorm(20),
  species = rep(c("A", "B"), each = 10)
)Introduction
Legends are an essential part of data visualization. They help us understand the meaning behind the colors and shapes in our plots. But what if your legend is too big or clutters your plot? Fear not, fellow R enthusiast! In this blog post, we’ll explore how to draw a legend outside of a plot using base R, with a step-by-step example that’s easy to follow.
Why Draw Legends Outside the Plot?
Drawing legends outside the plot is particularly useful when you have a lot of categories or when your legend is taking up too much space inside your plot. By moving it outside, you can make your plot cleaner and more aesthetically pleasing.
Examples
Step 1: Create Your Data
Let’s start by creating some sample data. We’ll use a simple scatterplot to demonstrate how to draw a legend outside of the plot. Imagine we have data on two different species of flowers, and we want to distinguish them with different colors.
Step 2: Create the Plot
Next, let’s create a scatterplot of our data using the plot() function.
# Create the scatterplot
plot(
  data$x, data$y,
  pch = ifelse(data$species == "A", 16, 17),
  col = ifelse(data$species == "A", "red", "blue"),
  main = "Scatterplot with Legend Outside"
)

# create margin around plot
par(mar = c(3, 3, 3, 8), xpd = TRUE)

# Draw the legend outside the plot with inset
legend(
  "topright",                           # Position of the legend
  legend = c("Species A", "Species B"), # Legend labels
  pch = c(16, 17),                      # Point shapes
  col = c("red", "blue"),               # Colors
  bty = "n",                            # No box around the legend
  inset = c(-0.1, 0)                   # Adjust the inset (move it to the left
)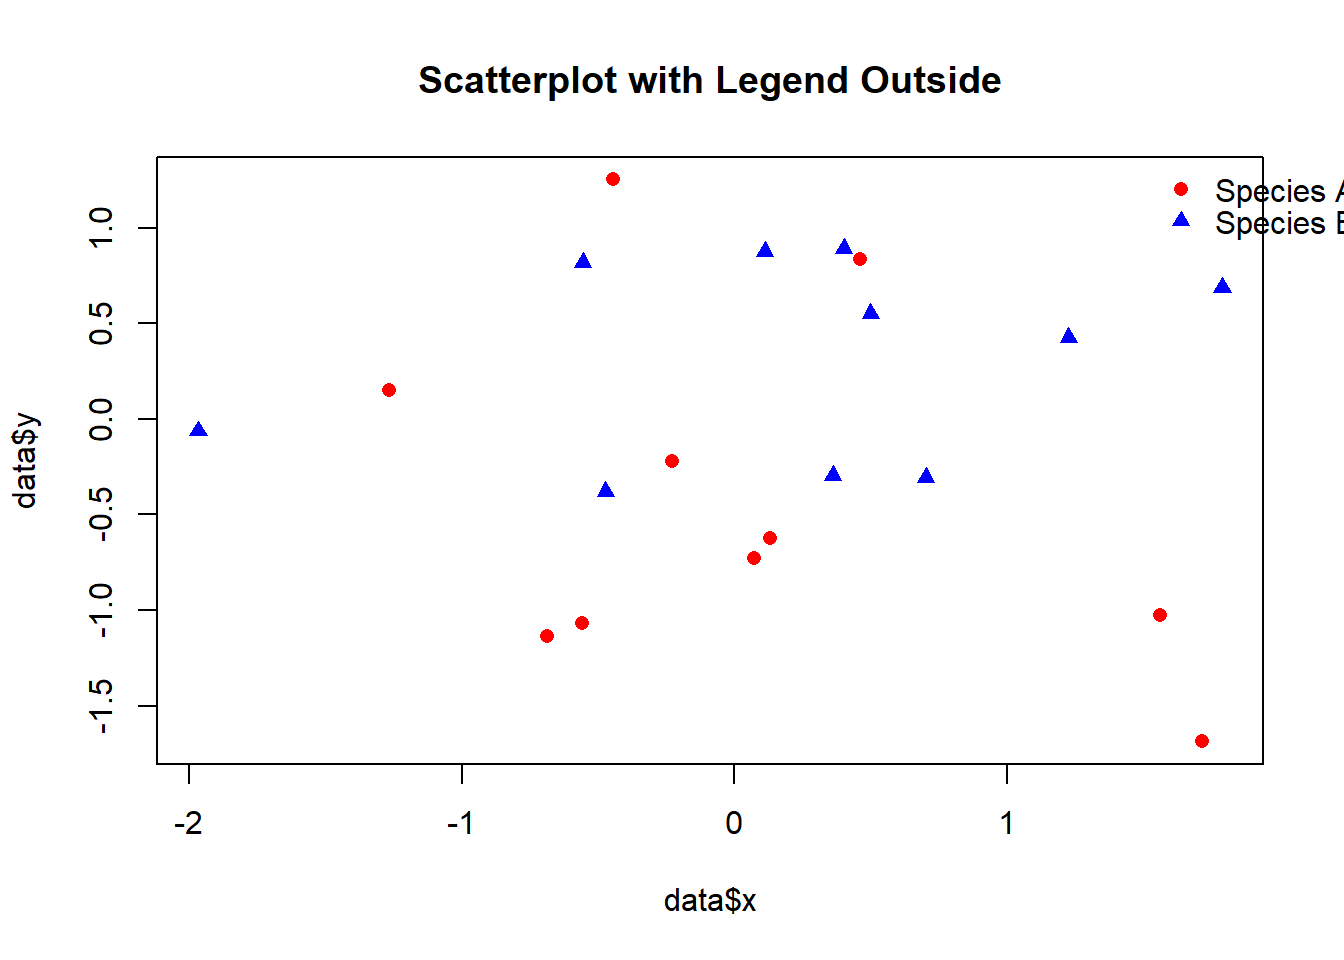
In this code, we’re using the pch argument to specify different point shapes based on the “species” variable and the col argument to set different colors. This creates a scatterplot with points that represent two species, A and B.
Step 3: Draw the Legend Outside
We already drew the legend but let’s now understand what we did. We’ll use the legend() function for this. Here’s how you can do it:
# Draw the legend outside the plot with inset
legend(
  "topright",                           # Position of the legend
  legend = c("Species A", "Species B"), # Legend labels
  pch = c(16, 17),                      # Point shapes
  col = c("red", "blue"),               # Colors
  bty = "n",                            # No box around the legend
  inset = c(-0.16, 0)                   # Adjust the inset (move it to the left)
)
In this code, we specify the position of the legend using the "topright" argument. We also provide labels, point shapes, and colors for our legend. The bty = "n" argument removes the box around the legend for a cleaner look.
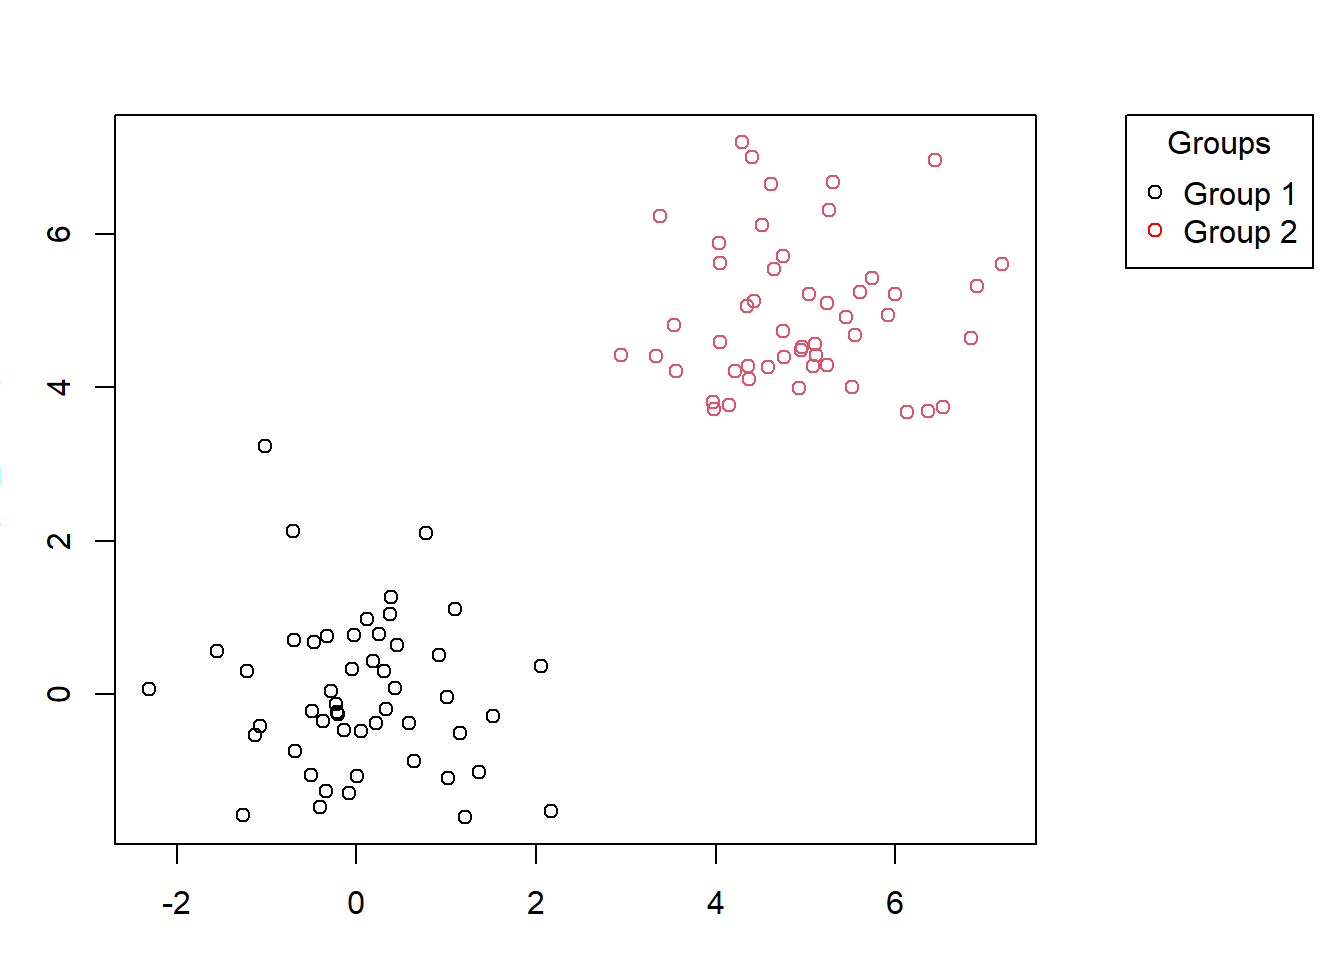
Example 2
# create sample data frame
sample_data <- data.frame(
  x = c(rnorm(50), rnorm(50, 5)),
  y = c(rnorm(50), rnorm(50, 5)),
  group = c(rep(1, 50), rep(2, 50))
)

# create margin around plot
par(mar = c(3, 3, 3, 8), xpd = TRUE)

# draw scatter plot
plot(sample_data$x, sample_data$y, pch = 1, col = sample_data$group)

# add legend outside of plot
legend(
  "topright",
  inset = c(-0.3, 0),
  legend = c("Group 1", "Group 2"),
  pch = 1,
  col = c("black", "red"),
  title = "Groups"
)
Step 4: Enjoy Your Plot
That’s it! You’ve successfully drawn a legend outside of your plot. Your scatterplot now looks clean, and the legend is clearly separated.
Conclusion
Drawing legends outside of a plot in base R is a valuable skill for data visualization. It allows you to present your data in a more organized and visually appealing way. I encourage you to try this technique with your own data. Experiment with different positions and styling options to make your plots shine.
Happy plotting, and may your data visualization skills continue to grow! If you have any questions or want to learn more R tips and tricks, feel free to reach out.