# Create a sample plot
plot(1:5, col = 1:5, pch = 19)

# Add a horizontal legend
legend("top", legend = c("A", "B", "C", "D", "E"),
       fill = 1:5, horiz = TRUE, x.intersp = 0.2)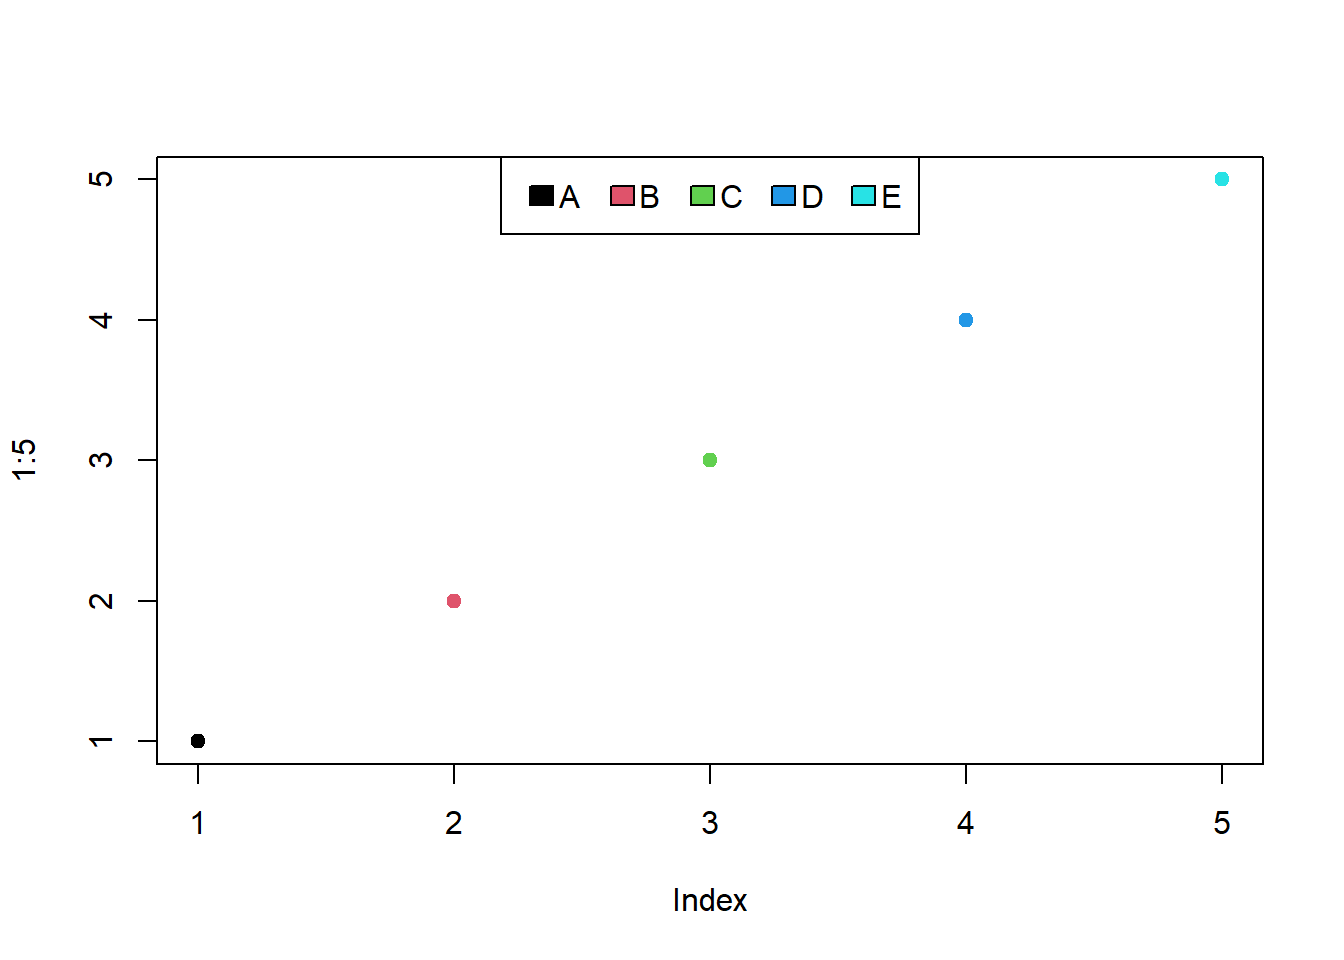
Creating a horizontal legend in base R can be a useful skill when you want to label multiple categories in a plot without taking up too much vertical space. In this blog post, we’ll explore various methods to create horizontal legends in R and provide examples with clear explanations.
Vertical legends are great for smaller plots, but in larger visualizations, they can become a space-consuming eyesore. Horizontal legends, on the other hand, allow you to neatly label categories without cluttering the plot area. They are especially useful when you have many categories to label.
legend FunctionThe most straightforward way to create a horizontal legend in base R is by using the legend function. Here’s a simple example:
# Create a sample plot
plot(1:5, col = 1:5, pch = 19)
# Add a horizontal legend
legend("top", legend = c("A", "B", "C", "D", "E"),
fill = 1:5, horiz = TRUE, x.intersp = 0.2)
In this code, we first create a basic scatter plot and then use the legend function to add a legend at the top of the plot ("top"). The horiz = TRUE argument specifies a horizontal legend.
You can further customize the horizontal legend to match your preferences. Here are some common parameters:
x.intersp controls the horizontal spacing between legend elements.inset adjusts the distance of the legend from the plot.title adds a title to the legend.# Customize the horizontal legend
legend("top", legend = c("A", "B", "C", "D", "E"),
fill = 1:5, horiz = TRUE, x.intersp = 0.2, inset = 0.02,
title = "Categories")In some cases, you might need multiple horizontal legends in a single plot. You can achieve this by specifying different locations for each legend.
# Create a sample plot
plot(1:5, col = 1:5, pch = 19)

# Add two horizontal legends
legend("top", legend = c("A", "B", "C"),
       fill = 1:3, horiz = TRUE, x.intersp = 0.2, inset = 0.02,
       title = "Top Legend")
legend("bottom", legend = c("D", "E"),
       fill = 4:5, horiz = TRUE, x.intersp = 0.2, inset = 0.02,
       title = "Bottom Legend")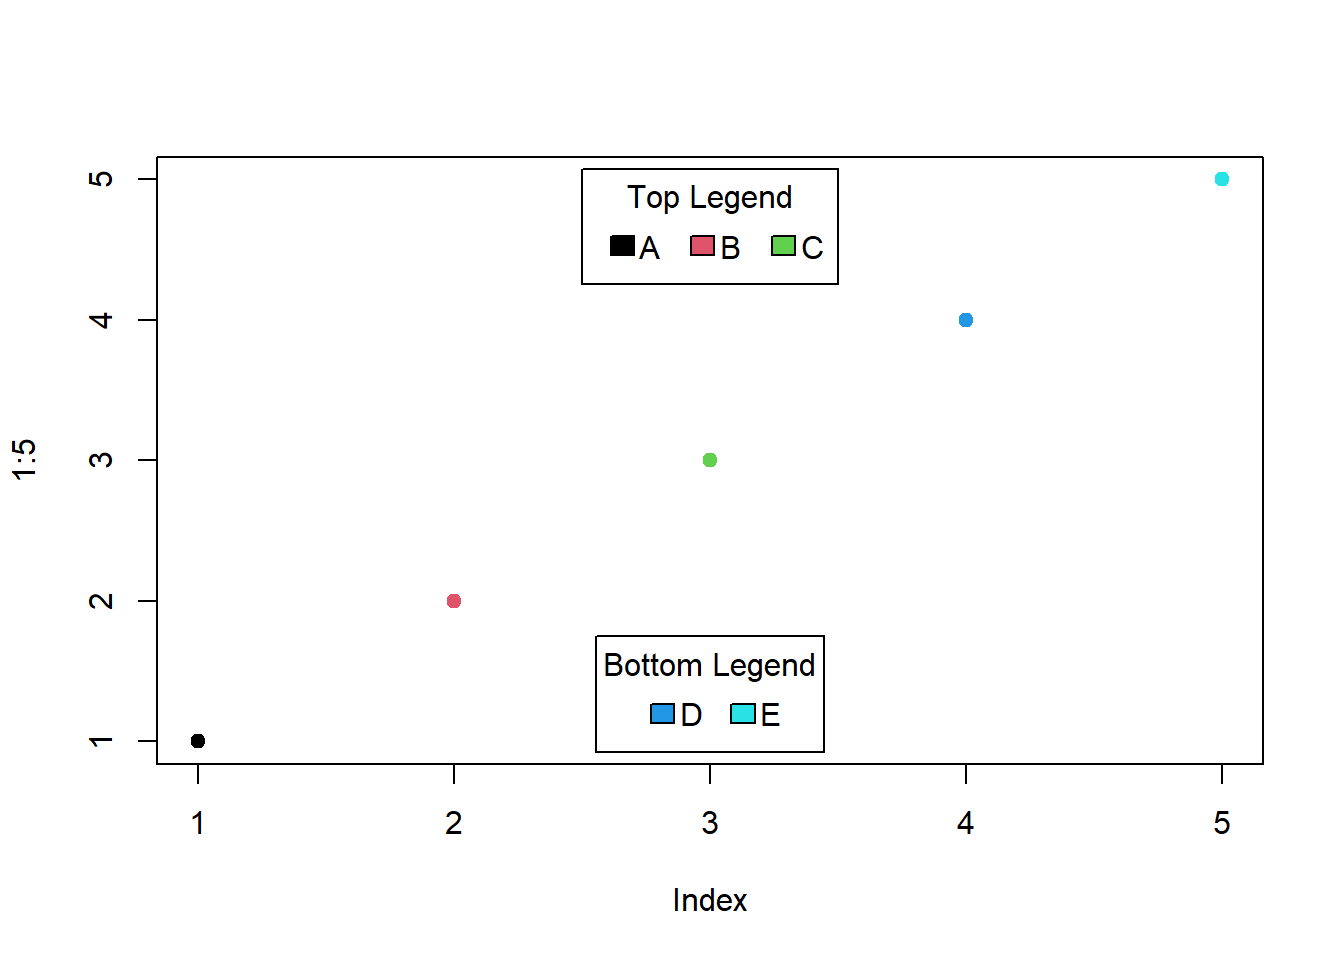
In this example, we add two horizontal legends at the top and bottom of the plot, each with its set of labels and colors.
Creating horizontal legends in base R is a versatile skill that you can use in various data visualization projects. I encourage you to experiment with different plot types, colors, and parameters to create the perfect horizontal legend for your specific needs. Don’t be afraid to get creative and tailor your legends to make your plots more informative and visually appealing.
By following these simple steps and experimenting with your own plots, you’ll be able to master the art of horizontal legends in R. So go ahead and give it a try! Your future visualizations will thank you for the extra clarity and elegance that horizontal legends provide. Happy coding!