exam_scores <- c(75, 82, 94, 68, 88, 90, 72, 85, 91, 79)Introduction
In the realm of statistics, a cumulative distribution function (CDF) serves as a crucial tool for understanding the behavior of data. It provides a comprehensive picture of how a variable’s values are distributed across its range. In this blog post, we’ll embark on an exciting journey to unravel the mysteries of CDFs and explore how to effortlessly calculate and visualize them using the powerful R programming language.
Understanding the Essence of CDFs
Before delving into the world of R programming, let’s first grasp the fundamental concept of a CDF. Imagine a group of students eagerly awaiting their exam results. The CDF for their scores would depict the probability of encountering a student with a score less than or equal to a specific value. For instance, if the CDF indicates a value of 0.7 at 80%, it implies that there’s a 70% chance of finding a student with a score of 80 or lower.
Calculating CDFs with the ecdf() Function
R, our trusty programming companion, offers a user-friendly function called ecdf() to calculate CDFs. This function takes a vector of data as input and returns a corresponding CDF object. Let’s put this function into action by generating a sample dataset of exam scores:
Now, we can effortlessly calculate the CDF using the ecdf() function:
cdf_scores <- ecdf(exam_scores)The cdf_scores object now holds the calculated CDF values for the exam scores.
Visualizing CDFs with the plot() Function
To gain a deeper understanding of the CDF, we can visualize it using the plot() function. This function takes the CDF object as input and generates a corresponding plot. Simply type the following command:
plot(cdf_scores)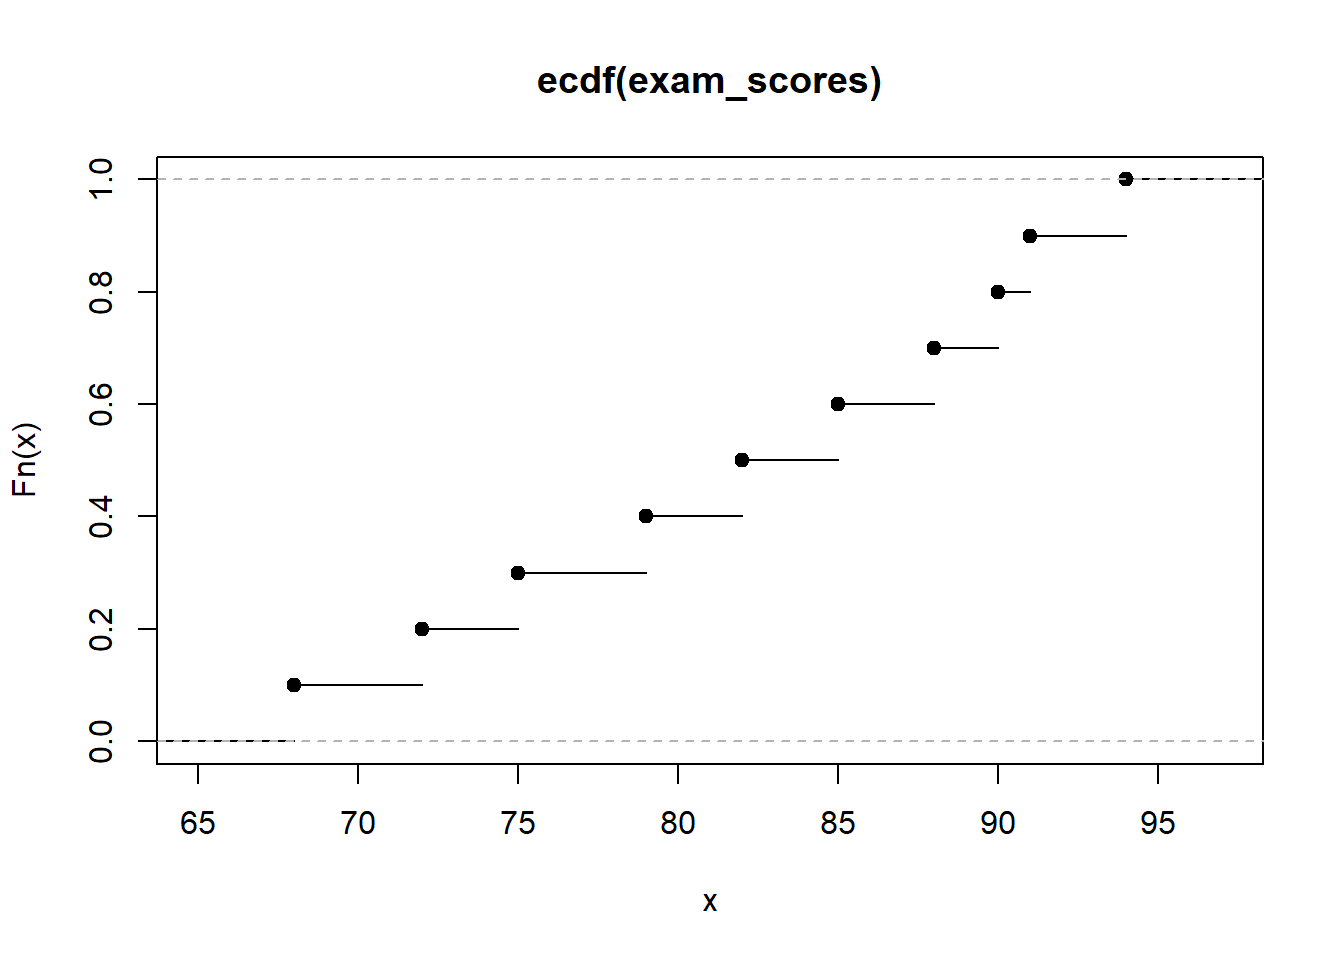
Voila! You should now see a captivating plot depicting the CDF of the exam scores. The x-axis represents the exam scores, and the y-axis represents the corresponding cumulative probabilities.
Explore!
We’ve successfully calculated and visualized CDFs in R. Now it’s time for you to explore and experiment with this powerful tool. Gather your own data, calculate the CDF, and interpret its meaning. Remember, data holds valuable insights, and CDFs are the keys to unlocking those insights.