Unlocking the Power of Prediction Intervals in R: A Practical Guide
rtip
Author
Steven P. Sanderson II, MPH
Published
November 13, 2023
Introduction
Prediction intervals are a powerful tool for understanding the uncertainty of your predictions. They allow you to specify a range of values within which you are confident that the true value will fall. This can be useful for many tasks, such as setting realistic goals, making informed decisions, and communicating your findings to others.
In this blog post, we will show you how to create a prediction interval in R using the mtcars dataset. The mtcars dataset is a built-in dataset in R that contains information about fuel economy, weight, displacement, and other characteristics of 32 cars.
Creating a Prediction Interval
To create a prediction interval in R, we can use the predict() function. The predict() function takes a fitted model and a new dataset as input and returns the predicted values for the new dataset.
We can also use the predict() function to calculate prediction intervals. To do this, we need to specify the interval argument. The interval argument can take two values: confidence and prediction.
A confidence interval is the range of values within which we are confident that the true mean of the population will fall. A prediction interval is the range of values within which we are confident that the true value of a new observation will fall.
To create a prediction interval for the mpg variable in the mtcars dataset, we can use the following code:
# Fit a linear modelmodel <-lm(mpg ~ disp, data = mtcars)# Create a prediction intervalprediction_intervals <-predict( model, newdata = mtcars, interval ="prediction", level =0.95 )# Print the prediction intervalhead(prediction_intervals)
The prediction interval shows that we are 95% confident that the true mpg value for a new car with a given displacement will fall within the range specified by the lwr and upr columns.
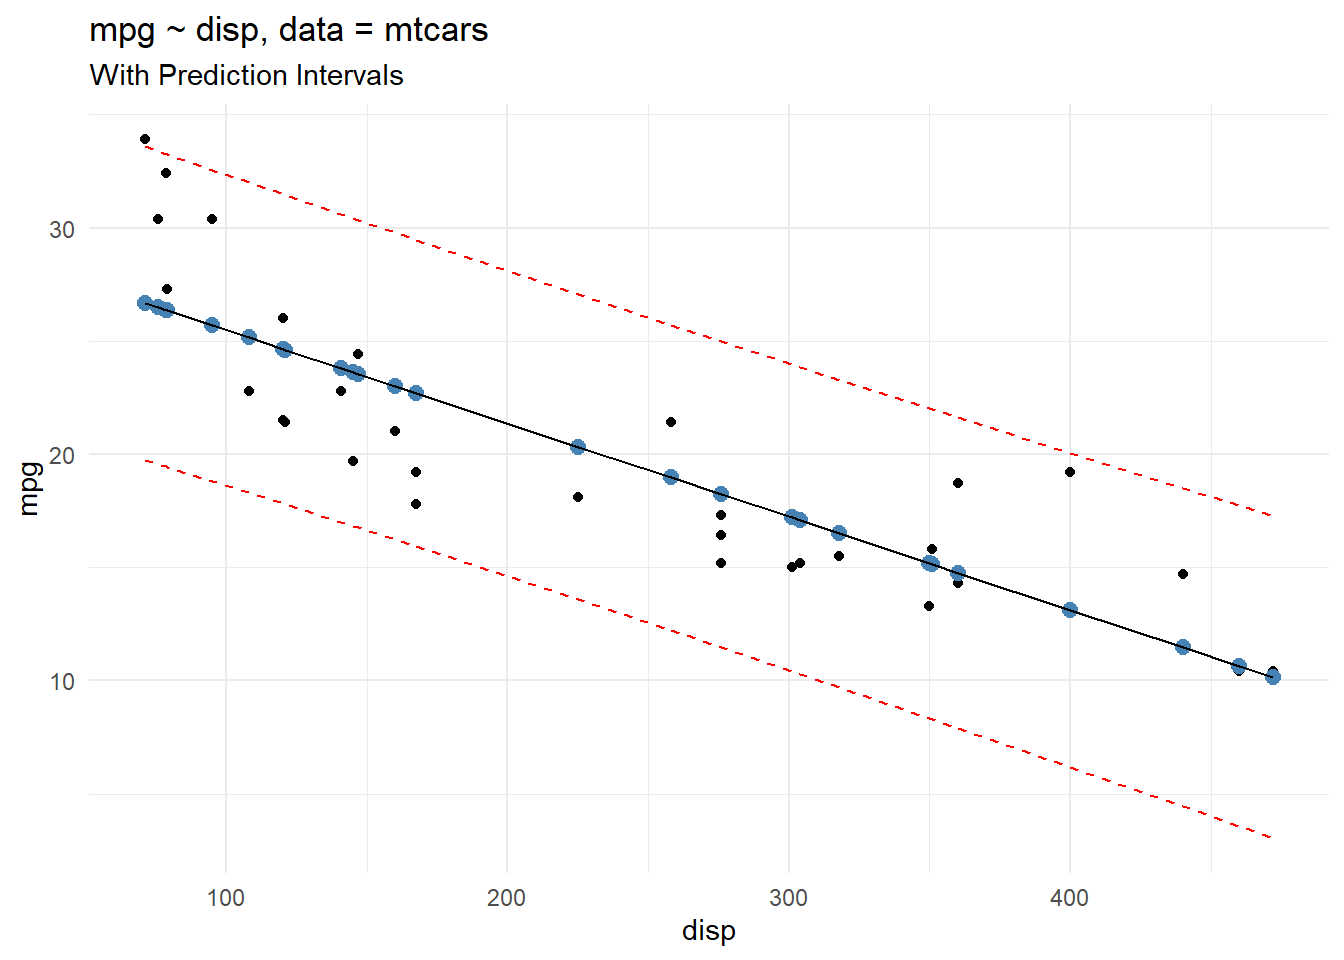
Now let’s plot the actual, the fitted and the prediction confidence bands.
library(ggplot2)full_res |>ggplot(aes(x = disp, y = mpg)) +geom_point() +geom_point(aes(y = fit), col ="steelblue", size =2.5) +geom_line(aes(y = fit)) +geom_line(aes(y = lwr), linetype ="dashed", col ="red") +geom_line(aes(y = upr), linetype ="dashed", col ="red") +theme_minimal() +labs(title ="mpg ~ disp, data = mtcars",subtitle ="With Prediction Intervals" )
Above we are capturing the prediction interval which gives us the uncertainty around a single point, whereas the confidence interval gives us the uncertainty around the mean predicted values. This means that the prediction interval will always be wider than the confidence interval for the same value.
Trying It Out Yourself
Now it’s your turn to try out creating a prediction interval in R. Here are some ideas:
Try creating a prediction interval for a different variable in the mtcars dataset, such as wt or hp.
Try creating a prediction interval for a variable in a different dataset.
Try creating a prediction interval for a more complex model, such as a multiple linear regression model or a logistic regression model.
Conclusion
Creating prediction intervals in R is a straightforward process. By using the predict() function, you can easily calculate prediction intervals for any fitted model and any new dataset. This can be a valuable tool for understanding the uncertainty of your predictions and making more informed decisions.