cum_skewness(.x)Function
In this post we will make a function cum_skewness() that will generate a vector output of the cumulative skewness of some given vector. The full function call is simply:
It only takes in a numeric vector, we are not going to write type checks in the function as it won’t be necessary for this post.
cum_skewness <- function(.x){
  skewness <- function(.x){
    sqrt(length(.x)) * sum((.x - mean(.x))^3 / (sum((.x))^2)^(3/2))
  }
  sapply(seq_along(.x), function(k, z) skewness(z[1:k]), z = .x)
}
Data
We are going to use the mtcars data set and use the mpg column for this example. Let’s set x equal to mtcars$mpg
x <- mtcars$mpgExample
Now let’s see the function in use.
cum_skewness(x) [1] 0.000000e+00 0.000000e+00 8.249747e-06 5.049149e-06 -1.113787e-05
[6] -8.569220e-06 -1.134377e-04 -8.440629e-05 -8.280585e-05 -5.457236e-05
[11] -3.209937e-05 -1.758922e-05 -5.567456e-06 1.436318e-07 -6.299325e-05
[16] -8.605705e-05 -5.869380e-05 1.594511e-04 1.675837e-04 2.221143e-04
[21] 1.855217e-04 1.936299e-04 1.998527e-04 2.082240e-04 1.897575e-04
[26] 1.505425e-04 1.180971e-04 9.974055e-05 1.048461e-04 9.801797e-05
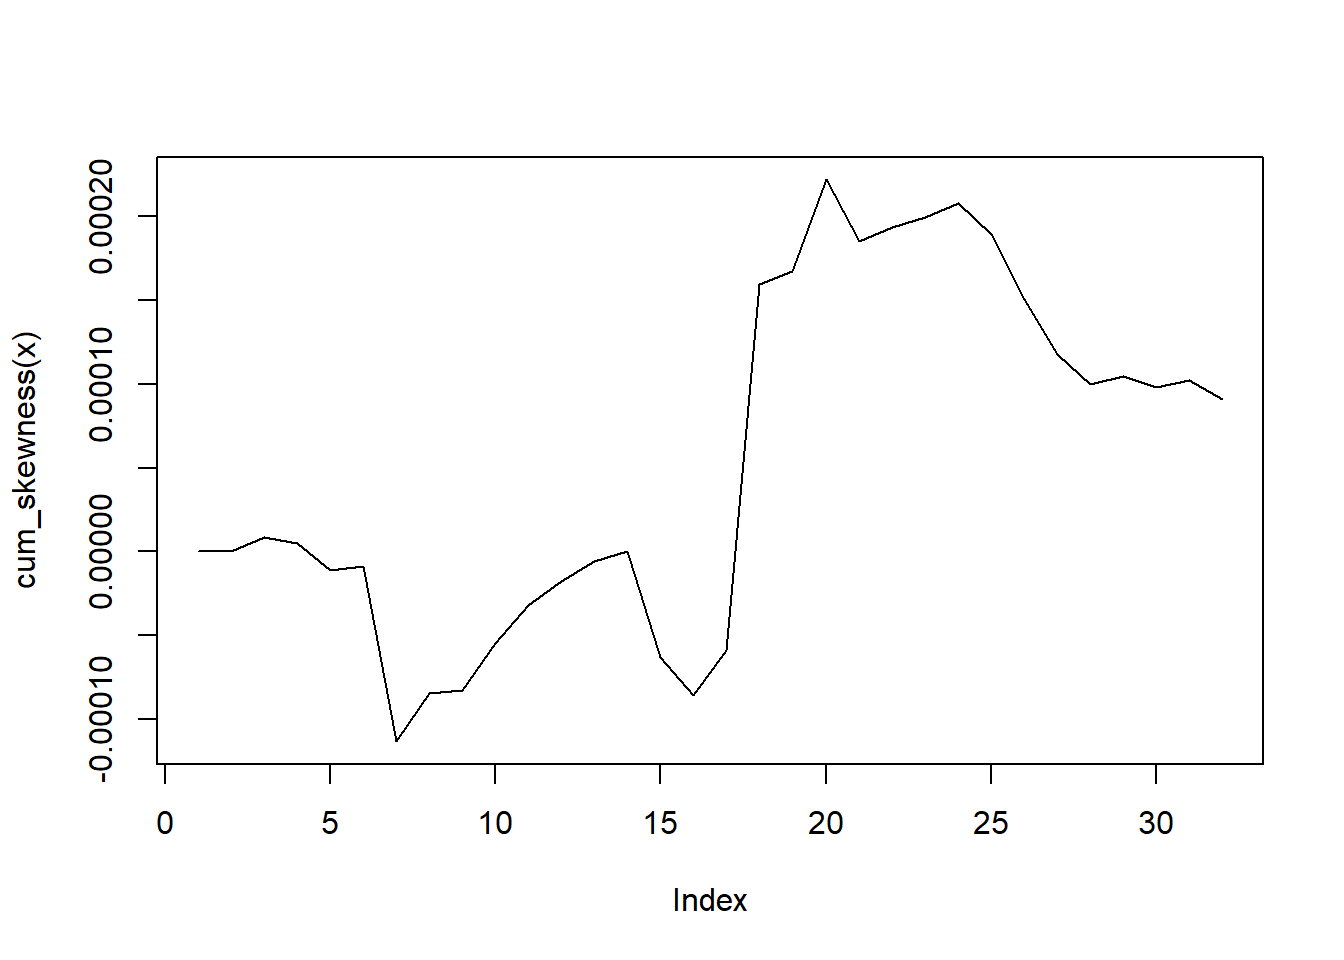
[31] 1.024713e-04 9.107160e-05Let’s plot it out.
plot(cum_skewness(x), type = "l")