hai_hyperbolic_vec(.x, .scale_type = c("sin", "cos", "tan", "sincos"))Introduction
In data modeling there can be instanes where you will want some sort of hyperbolic transformation of your data. In {healthyR.ai} this is easy with the use of the function hai_hyperbolic_vec() along with it’s corresponding augment and step functions.
Function
The function takes in a numeric vector as it’s argument and will transform the data with one of the following:
sincostansincosThis will do:value = sin(x) * cos(x)
The full function call is:
Example
library(dplyr)
library(healthyR.ai)
library(tidyr)
library(ggplot2)

len_out <- 25
by_unit <- "month"
start_date <- as.Date("2021-01-01")

data_tbl <- tibble(
  date_col = seq.Date(
    from = start_date,
    length.out = len_out,
    by = by_unit
    ),
  b = runif(len_out),
  fv_sin = hai_hyperbolic_vec(b, .scale_type = "sin"),
  fv_cos = hai_hyperbolic_vec(b, .scale_type = "cos"),
  fv_sc  = hai_hyperbolic_vec(b, .scale_type = "sincos")
)

data_tbl
# A tibble: 25 × 5
date_col b fv_sin fv_cos fv_sc
<date> <dbl> <dbl> <dbl> <dbl>
1 2021-01-01 0.961 0.820 0.573 0.470
2 2021-02-01 0.418 0.406 0.914 0.371
3 2021-03-01 0.0729 0.0728 0.997 0.0726
4 2021-04-01 0.426 0.413 0.911 0.376
5 2021-05-01 0.851 0.752 0.659 0.496
6 2021-06-01 0.824 0.734 0.679 0.499
7 2021-07-01 0.659 0.612 0.791 0.484
8 2021-08-01 0.683 0.631 0.776 0.490
9 2021-09-01 0.173 0.172 0.985 0.169
10 2021-10-01 0.345 0.338 0.941 0.318
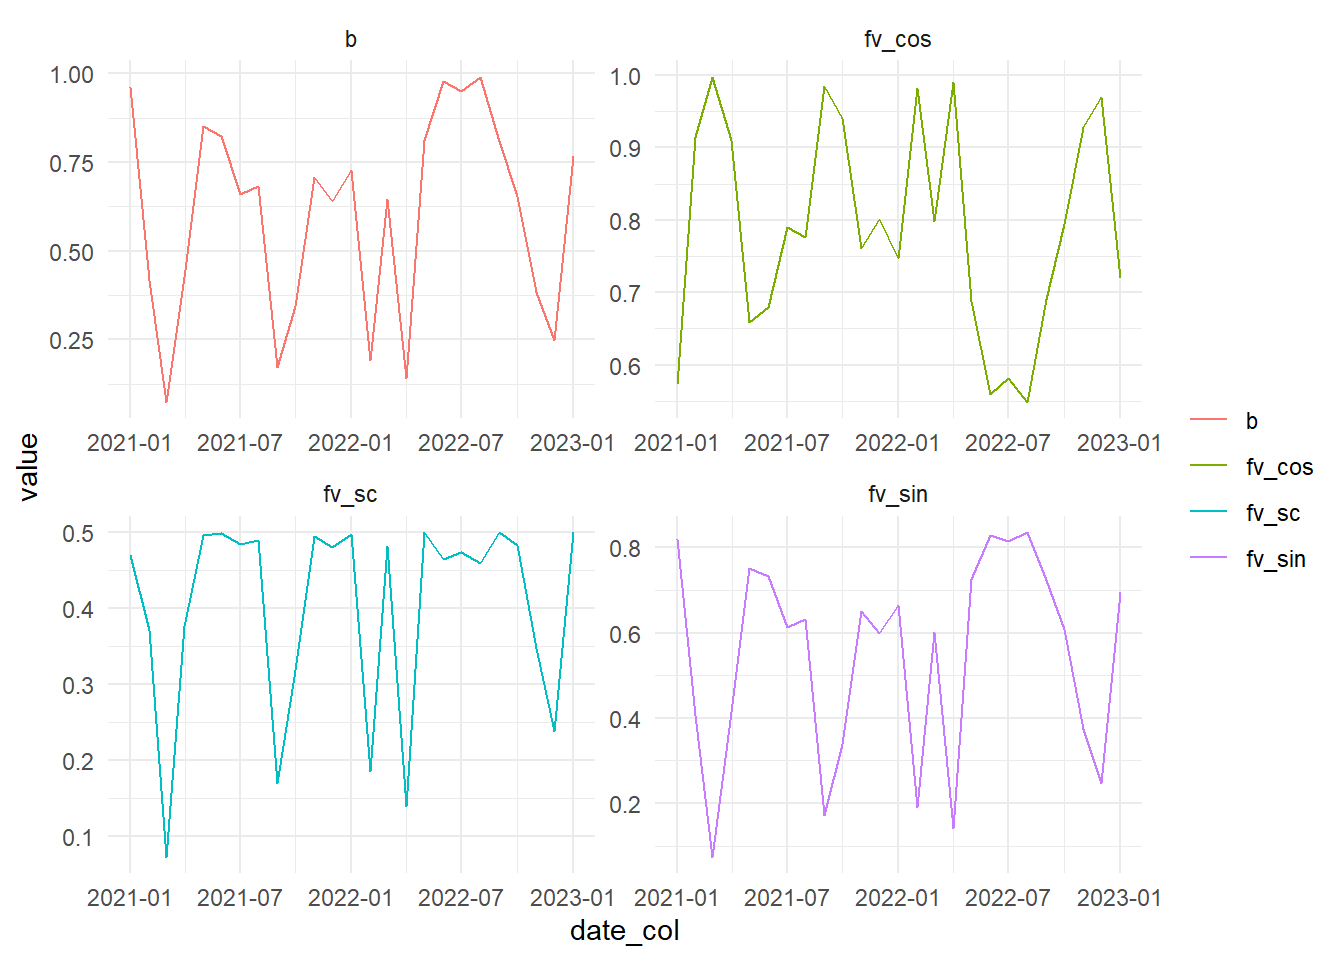
# … with 15 more rowsVisual
data_tbl %>%
  pivot_longer(cols = -date_col) %>%
  ggplot(aes(x = date_col, y = value, color = name)) +
  geom_line() +
  facet_wrap(~ name, scales = "free") +
  theme_minimal() +
  labs(color = "")