step_hai_scale_zscore(
  recipe,
  ...,
  role = "predictor",
  trained = FALSE,
  columns = NULL,
  skip = FALSE,
  id = rand_id("hai_scale_zscore")
)Introduction
Sometimes one may find it useful or necessary to scale their data during a modeling or analysis phase. One of these such transformations is the z-score scaling.
This is done simply by performing the below transform where x is simply some numeric vector:
\[ z_x = (x - mu(x))/sd(x) \]
Let’s take a look at the recipe function called step_hai_scale_zscore
Function
Here is the full function call:
Here are the arguments to the function.
recipe- A recipe object. The step will be added to the sequence of operations for this recipe....- One or more selector functions to choose which variables that will be used to create the new variables. The selected variables should have class numericrole- For model terms created by this step, what analysis role should they be assigned?. By default, the function assumes that the new variable columns created by the original variables will be used as predictors in a model.trained- A logical to indicate if the quantities for preprocessing have been estimated.columns- A character string of variables that will be used as inputs. This field is a placeholder and will be populated once recipes::prep() is used.skip- A logical. Should the step be skipped when the recipe is baked by bake.recipe()? While all operations are baked when prep.recipe() is run, some operations may not be able to be conducted on new data (e.g. processing the outcome variable(s)). Care should be taken when using skip = TRUE as it may affect the computations for subsequent operations.id- A character string that is unique to this step to identify it.
Example
Here is a simple example.
library(healthyR.ai)
library(dplyr)
library(recipes)

df <- iris |>
  as_tibble() |>
  select(Species, Sepal.Length)

rec_obj <- recipe(Sepal.Length ~ ., data = df) %>%
  step_hai_scale_zscore(Sepal.Length)

rec_obj
Recipe
Inputs:
role #variables
outcome 1
predictor 1
Operations:
Zero-One Scale Transformation on Sepal.Lengthsummary(rec_obj)# A tibble: 2 × 4
variable type role source
<chr> <list> <chr> <chr>
1 Species <chr [3]> predictor original
2 Sepal.Length <chr [2]> outcome originalNow let’s take a look at the differences.
library(ggplot2)
library(plotly)

df_tbl <- get_juiced_data(rec_obj)

df_tbl |>
  purrr::set_names("Species","Sepal_Length","Scaled_Sepal_Length") |>
  ggplot(aes(x = Sepal_Length)) +
  geom_histogram(color = "black", fill = "lightgreen") +
  geom_histogram(aes(x = Scaled_Sepal_Length),
                 color = "black", fill = "steelblue") +
  theme_minimal() +
  labs(
    y = "Count",
    x = "Sepal Length",
    title = "Speal.Length: Original vs. Z-Score Scaled",
    subtitle = "Original (Light Green) Scaled (Steelblue)"
  )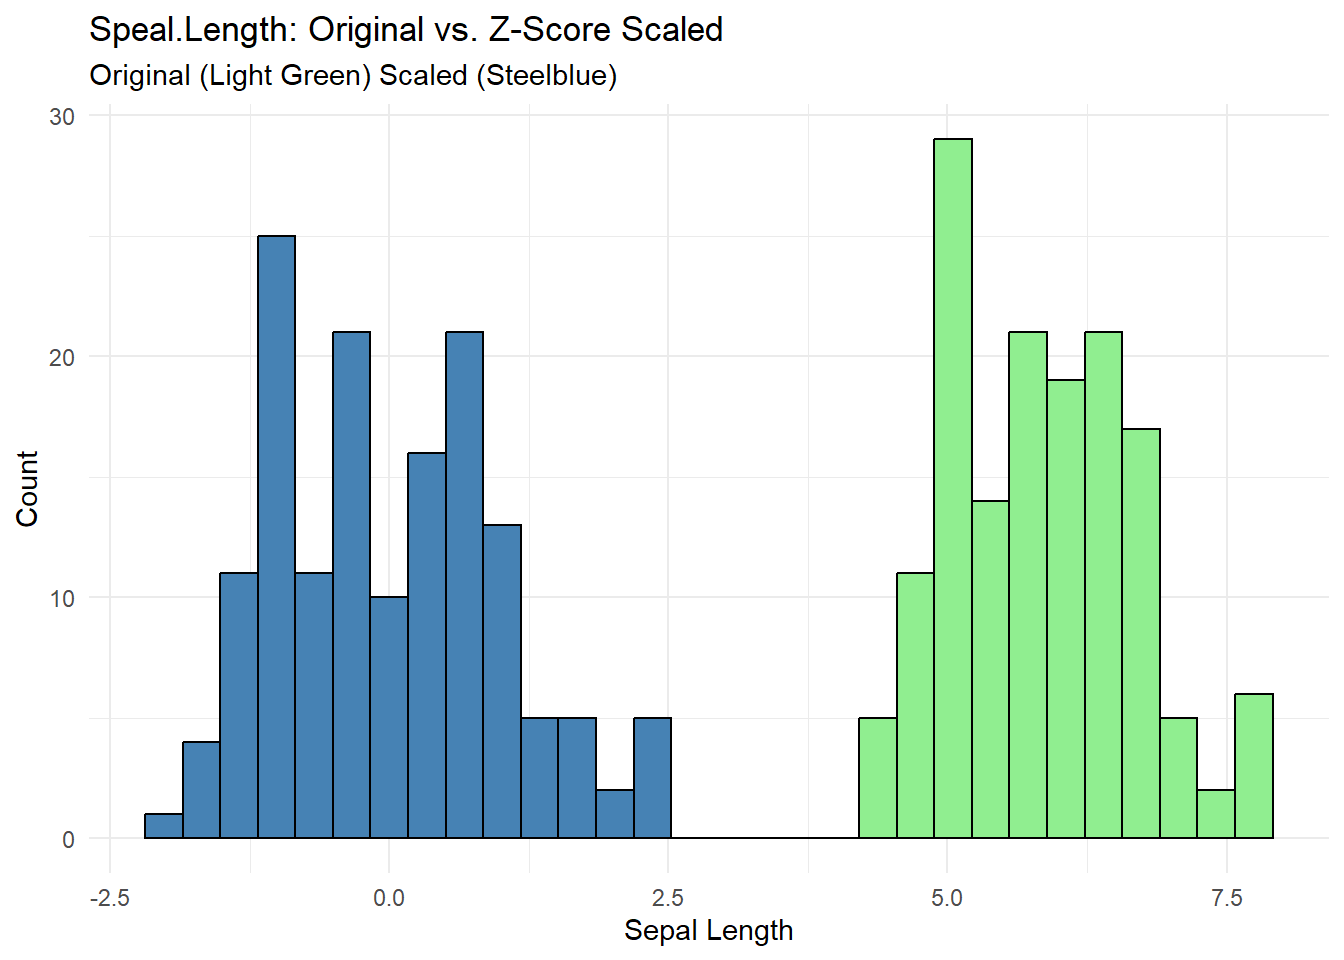
Voila!