hai_kmeans_automl(
  .data,
  .split_ratio = 0.8,
  .seed = 1234,
  .centers = 10,
  .standardize = TRUE,
  .print_model_summary = TRUE,
  .predictors,
  .categorical_encoding = "auto",
  .initialization_mode = "Furthest",
  .max_iterations = 100
)Introduction
Today’s post is going to center around the automatic k-means functionality of {healthyR.ai}. I am not going to get into what it is or how it works, but rather the function call itself and how it works and what it puts out. The function is called hai_kmeans_automl. This function is a wrapper around the h2o::h2o.kmeans() function, but also does some processing to enhance the output at the end. Let’s get to it!
Function
Here is the full function call.
Now let’s go over the function arguments:
.data- The data that is to be passed for clustering..split_ratio- The ratio for training and testing splits..seed- The default is 1234, but can be set to any integer..centers- The default is 1. Specify the number of clusters (groups of data) in a data set..standardize- The default is set to TRUE. When TRUE all numeric columns will be set to zero mean and unit variance..print_model_summary- This is a boolean and controls if the model summary is printed to the console. The default is TRUE..predictors- This must be in the form of c(“column_1”, “column_2”, … “column_n”).categorical_encoding- Can be one of the following:- “auto”
- “enum”
- “one_hot_explicit”
- “binary”
- “eigen”
- “label_encoder”
- “sort_by_response”
- “enum_limited”
.initialization_mode- This can be one of the following:- “Random”
- “Furthest (default)
- “PlusPlus”
.max_iterations- The default is 100. This specifies the number of training iterations
Examples
Time for some examples.
library(healthyR.ai)
library(h2o)

h2o.init()

output <- hai_kmeans_automl(
  .data = iris,
  .predictors = c(
    "Sepal.Width", "Sepal.Length", "Petal.Width", "Petal.Length"
    ),
  .standardize = TRUE,
  .split_ratio = .8
)

h2o.shutdown(prompt = FALSE)
Now let’s take a look at the output. There are going to be 4 pieces of main output. Here they are:
dataauto_kmeans_objmodel_idscree_plt
Let’s take a look at each one. First the data output which itself has 6 different objects in it.
output$data$splits
$splits$training_tbl
# A tibble: 123 × 5
Sepal.Length Sepal.Width Petal.Length Petal.Width Species
<dbl> <dbl> <dbl> <dbl> <fct>
1 5.1 3.5 1.4 0.2 setosa
2 4.9 3 1.4 0.2 setosa
3 4.7 3.2 1.3 0.2 setosa
4 5 3.6 1.4 0.2 setosa
5 5.4 3.9 1.7 0.4 setosa
6 4.6 3.4 1.4 0.3 setosa
7 5 3.4 1.5 0.2 setosa
8 4.4 2.9 1.4 0.2 setosa
9 5.4 3.7 1.5 0.2 setosa
10 4.8 3.4 1.6 0.2 setosa
# … with 113 more rows
$splits$validate_tbl
# A tibble: 27 × 5
Sepal.Length Sepal.Width Petal.Length Petal.Width Species
<dbl> <dbl> <dbl> <dbl> <fct>
1 4.6 3.1 1.5 0.2 setosa
2 4.9 3.1 1.5 0.1 setosa
3 5.8 4 1.2 0.2 setosa
4 5.1 3.5 1.4 0.3 setosa
5 5.7 3.8 1.7 0.3 setosa
6 5.1 3.8 1.5 0.3 setosa
7 5.4 3.4 1.7 0.2 setosa
8 5.1 3.7 1.5 0.4 setosa
9 5 3.4 1.6 0.4 setosa
10 4.7 3.2 1.6 0.2 setosa
# … with 17 more rows
$metrics
$metrics$training_metrics
# A tibble: 2 × 3
centroid size within_cluster_sum_of_squares
<dbl> <dbl> <dbl>
1 1 87 145.
2 2 36 38.3
$metrics$validation_metrics
# A tibble: 2 × 3
centroid size within_cluster_sum_of_squares
<dbl> <dbl> <dbl>
1 1 13 35.7
2 2 14 13.4
$metrics$cv_metric_summary
# A tibble: 5 × 8
metric_name mean sd cv_1_valid cv_2_valid cv_3_valid cv_4_valid cv_5_va…¹
<chr> <dbl> <dbl> <dbl> <dbl> <dbl> <dbl> <dbl>
1 betweenss 62.5 12.4 66.7 72.7 71.6 42.5 59.1
2 mse NaN 0 NaN NaN NaN NaN NaN
3 rmse NaN 0 NaN NaN NaN NaN NaN
4 tot_withinss 33.6 7.36 45.6 29.7 34.8 26.5 31.3
5 totss 96.1 17.1 112. 102. 106. 69.0 90.3
# … with abbreviated variable name ¹cv_5_valid
$original_data
Sepal.Length Sepal.Width Petal.Length Petal.Width Species
1 5.1 3.5 1.4 0.2 setosa
2 4.9 3.0 1.4 0.2 setosa
3 4.7 3.2 1.3 0.2 setosa
4 4.6 3.1 1.5 0.2 setosa
5 5.0 3.6 1.4 0.2 setosa
6 5.4 3.9 1.7 0.4 setosa
[150 rows x 5 columns]
$scree_data_tbl
# A tibble: 2 × 2
centers wss
<dbl> <dbl>
1 1 745.
2 2 226.
$scoring_history_tbl
# A tibble: 6 × 6
timestamp duration iterations number_of_clusters numbe…¹ withi…²
<chr> <chr> <dbl> <dbl> <dbl> <dbl>
1 2023-01-16 09:41:25 " 0.241 sec" 0 0 NaN NaN
2 2023-01-16 09:41:25 " 0.246 sec" 1 1 123 1003.
3 2023-01-16 09:41:25 " 0.247 sec" 2 1 0 488
4 2023-01-16 09:41:25 " 0.250 sec" 3 2 26 311.
5 2023-01-16 09:41:25 " 0.251 sec" 4 2 2 184.
6 2023-01-16 09:41:25 " 0.251 sec" 5 2 0 183.
# … with abbreviated variable names ¹number_of_reassigned_observations,
# ²within_cluster_sum_of_squares
$model_summary_tbl
# A tibble: 7 × 2
name value
<chr> <dbl>
1 number_of_rows 123
2 number_of_clusters 2
3 number_of_categorical_columns 0
4 number_of_iterations 5
5 within_cluster_sum_of_squares 183.
6 total_sum_of_squares 488
7 between_cluster_sum_of_squares 305.Now lets take a look at the auto_kmeans_obj
output$auto_kmeans_objModel Details:
==============
H2OClusteringModel: kmeans
Model ID: KMeans_model_R_1673880074548_1
Model Summary:
number_of_rows number_of_clusters number_of_categorical_columns
1 123 2 0
number_of_iterations within_cluster_sum_of_squares total_sum_of_squares
1 5 183.42511 488.00000
between_cluster_sum_of_squares
1 304.57489
H2OClusteringMetrics: kmeans
** Reported on training data. **
Total Within SS: 183.4251
Between SS: 304.5749
Total SS: 488
Centroid Statistics:
centroid size within_cluster_sum_of_squares
1 1 87.00000 145.14706
2 2 36.00000 38.27805
H2OClusteringMetrics: kmeans
** Reported on validation data. **
Total Within SS: 49.05625
Between SS: 53.9303
Total SS: 102.9865
Centroid Statistics:
centroid size within_cluster_sum_of_squares
1 1 13.00000 35.67618
2 2 14.00000 13.38007
H2OClusteringMetrics: kmeans
** Reported on cross-validation data. **
** 5-fold cross-validation on training data (Metrics computed for combined holdout predictions) **
Total Within SS: 167.8887
Between SS: 320.1113
Total SS: 488
Centroid statistics are not available.
Cross-Validation Metrics Summary:
mean sd cv_1_valid cv_2_valid cv_3_valid cv_4_valid
betweenss 62.496490 12.417224 66.671760 72.679665 71.595474 42.470100
mse NA 0.000000 NA NA NA NA
rmse NA 0.000000 NA NA NA NA
tot_withinss 33.577747 7.357984 45.607327 29.705257 34.811970 26.512373
totss 96.074234 17.148642 112.279080 102.384926 106.407450 68.982475
cv_5_valid
betweenss 59.065456
mse NA
rmse NA
tot_withinss 31.251806
totss 90.317260The model id:
output$model_id[1] "KMeans_model_R_1673880074548_1"And finally the scree_plt.
output$scree_plt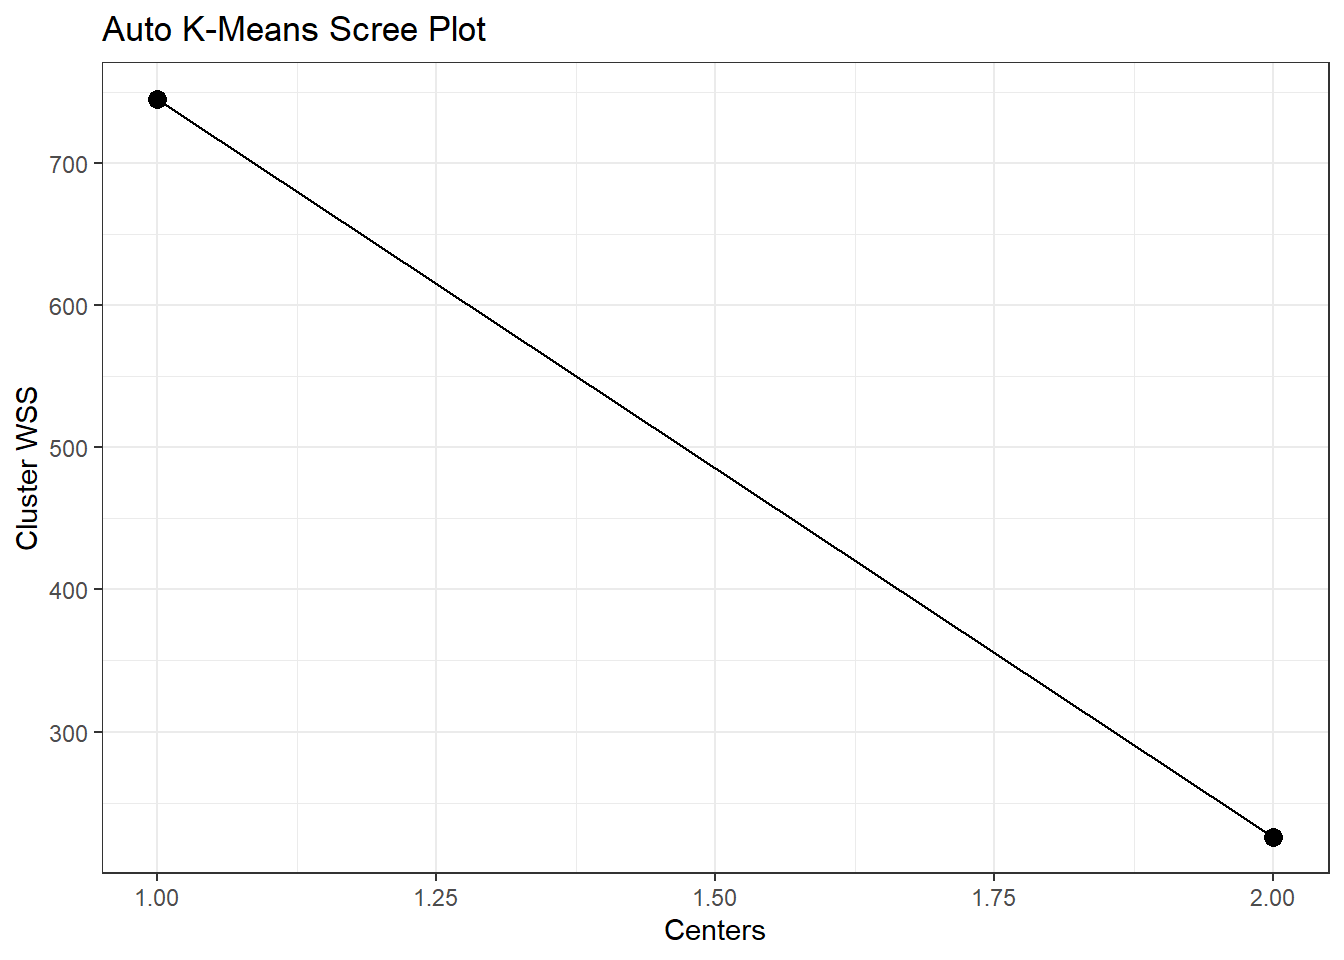
Voila!