cmean()Introduction
Cumulative mean is a statistical measure that calculates the mean of a set of numbers up to a certain point in time or after a certain number of observations. It is also known as a running average or moving average.
Cumulative mean can be useful in a variety of contexts. For example:
Tracking progress: Cumulative mean can be used to track progress over time. For instance, a teacher might use it to track the average test scores of her students throughout the school year.
Analyzing trends: Cumulative mean can help identify trends in data. For example, a business might use it to track the average revenue generated by a new product over the course of several months.
Smoothing data: Cumulative mean can be used to smooth out fluctuations in data. For instance, a meteorologist might use it to calculate the average temperature over the course of a year, which would help to smooth out the effects of daily temperature fluctuations.
In summary, cumulative mean is a useful statistical measure that can help track progress, analyze trends, and smooth out fluctuations in data.
Function
The function we will review is cmean() from the {TidyDensity} R package. Let’s take a look at it.
The only argument is .x which is a numeric vector as this is a vectorized function. Let’s see it in use.
Example
First let’s load in TidyDensity
library(TidyDensity)Ok now let’s make some data. For this we are going to use the simple rnorm() function.
x <- rnorm(100)

head(x)
[1] -0.8293250 -1.2983499 2.2782337 -0.1521549 0.6859169 0.3809020Ok, now that we have our vector, let’s run it through the function and see what it outputs and then we will graph it.
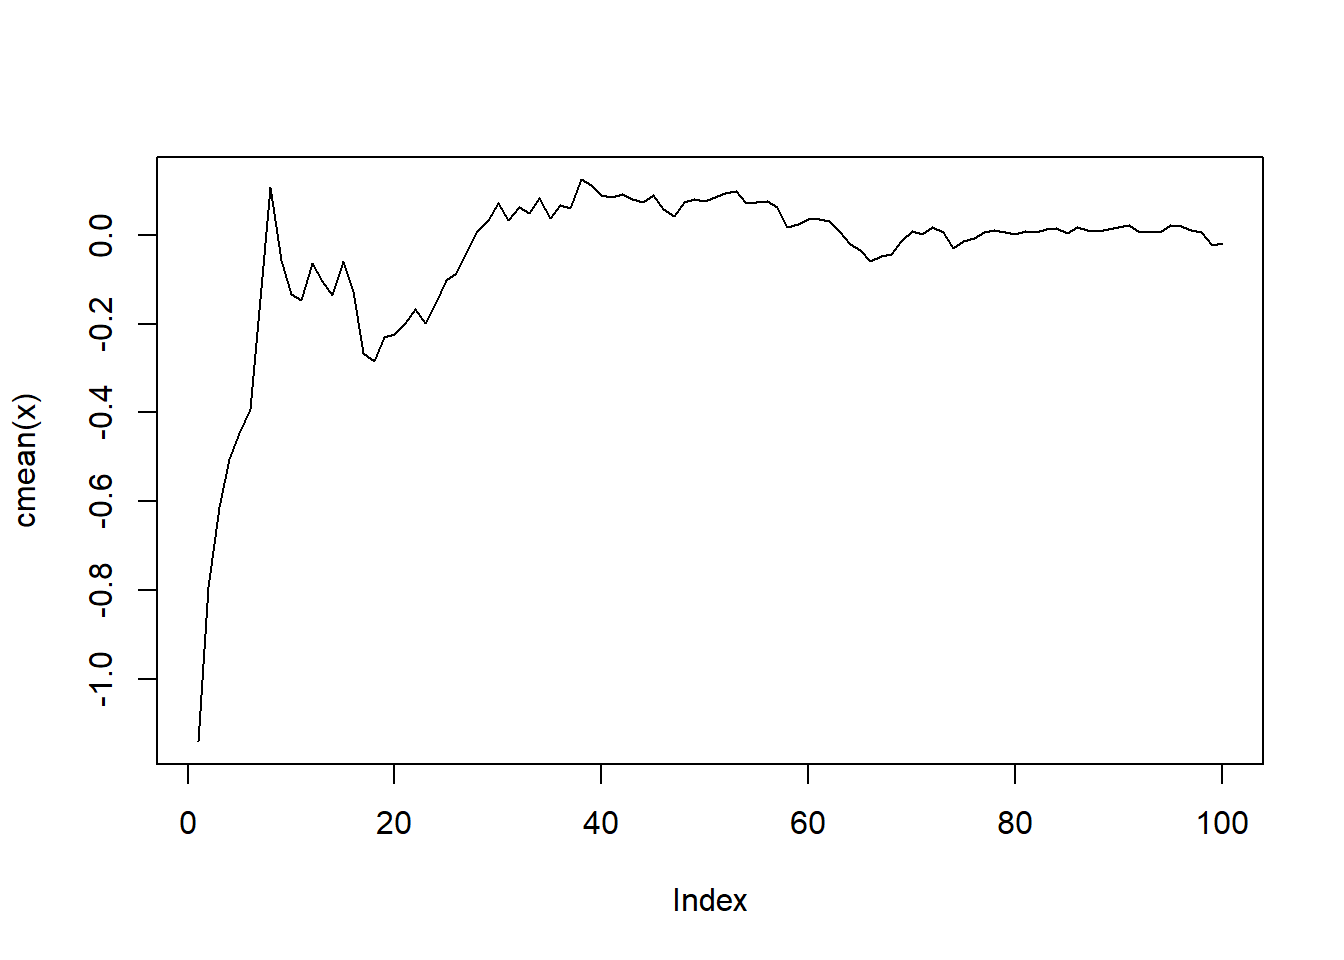
cmx <- cmean(x)
head(cmx)
[1] -0.8293249774 -1.0638374319 0.0501862766 -0.0003990095 0.1368641726
[6] 0.1775371452Now let’s graph it.
plot(cmx, type = "l")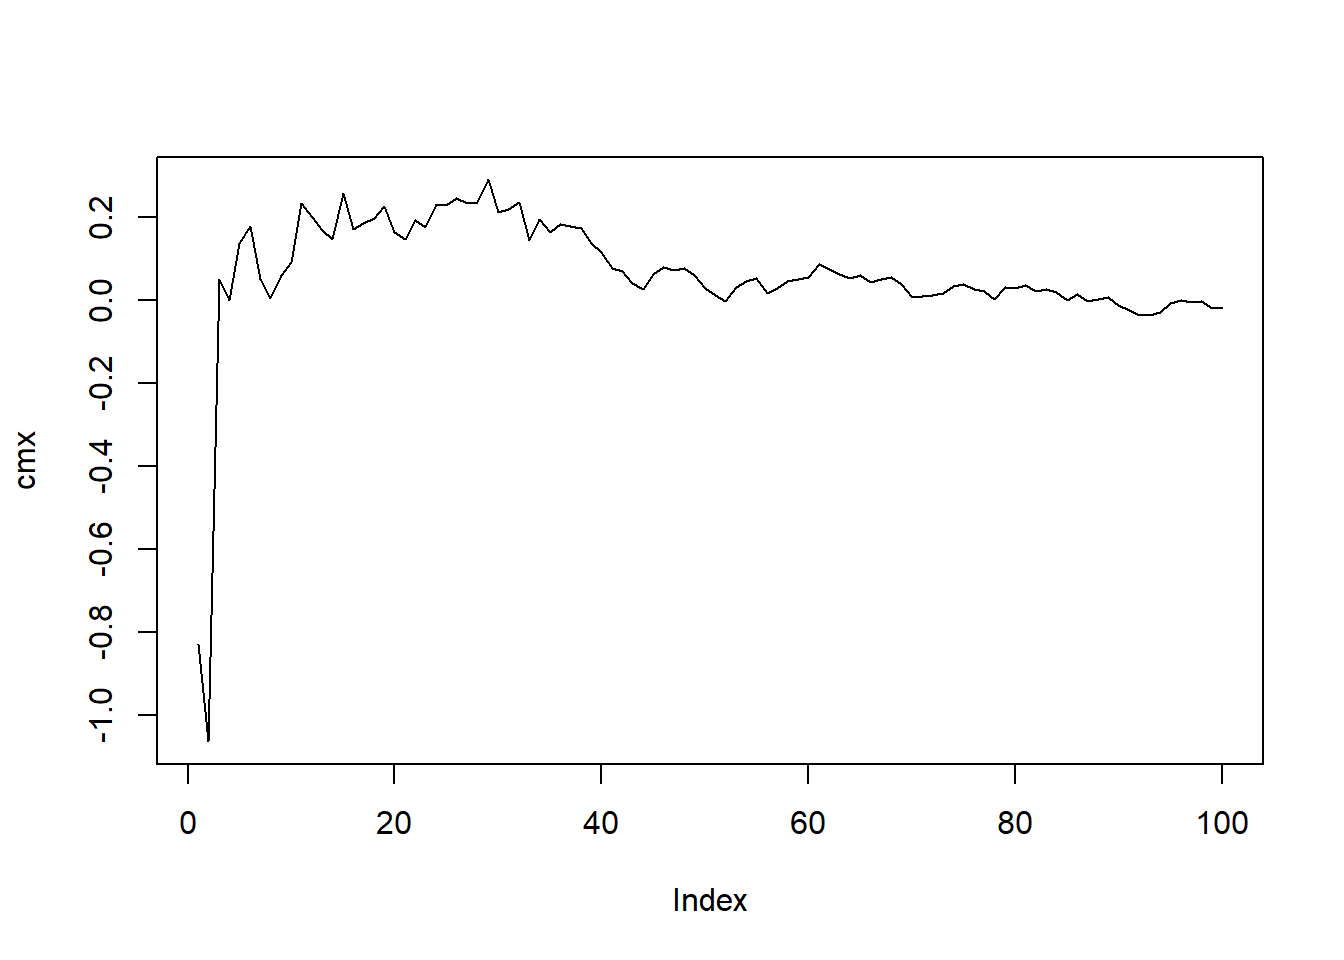
Ok nice, so can we do this on grouped data or lists of data? Of course! First let’s use a for loop to generate a list of rnorm() values.
# Initialize an empty list to store the generated values
my_list <- list()

# Generate values using rnorm(5) in a for loop and store them in the list
for (i in 1:5) {
  my_list[[i]] <- rnorm(100)
}

# Print the generated list
purrr::map(my_list, head)
[[1]]
[1] -0.8054353 -0.4596541 -0.2362475 1.1486398 -0.7242154 0.5184610
[[2]]
[1] 0.3243327 0.7170802 -0.5963424 -1.0307104 0.3388504 0.5717486
[[3]]
[1] 1.7360816 -1.0359467 -0.3206138 -1.2157684 -0.8841356 0.1856481
[[4]]
[1] -1.1401642 -0.4437817 -0.2555245 -0.1809040 -0.2131763 -0.1251750
[[5]]
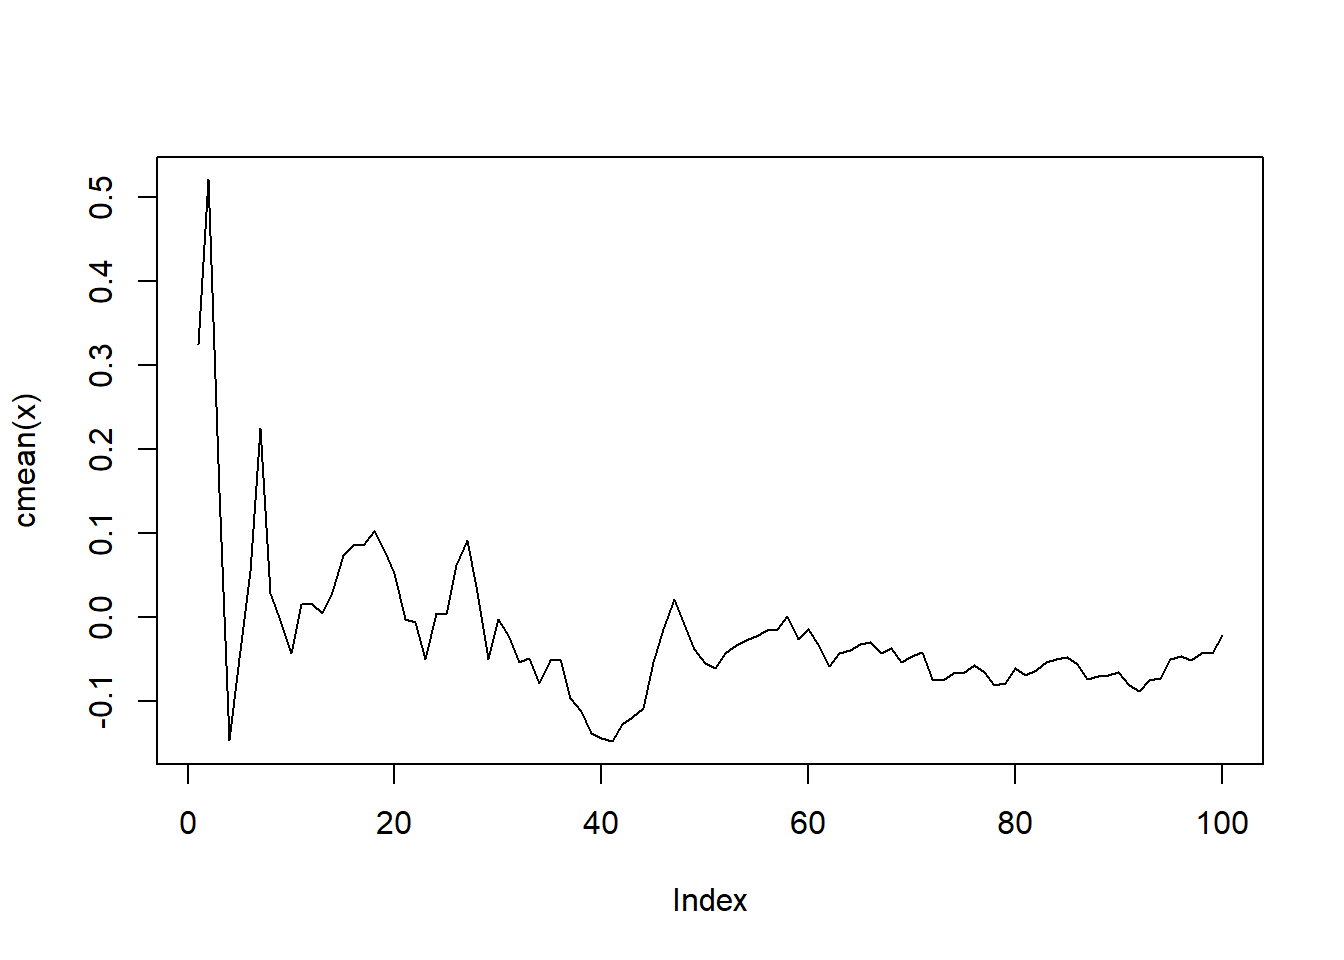
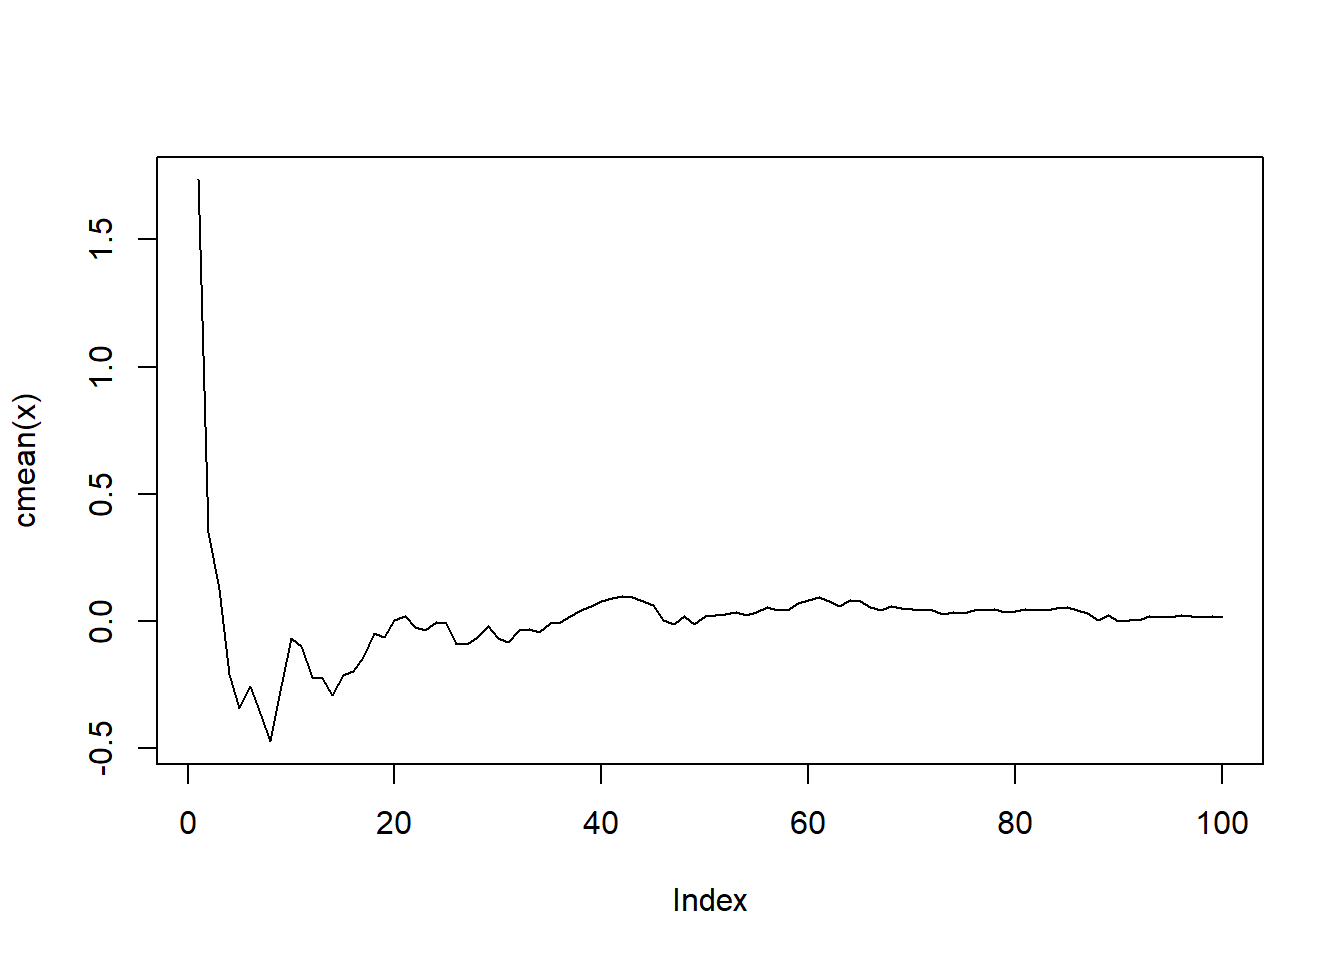
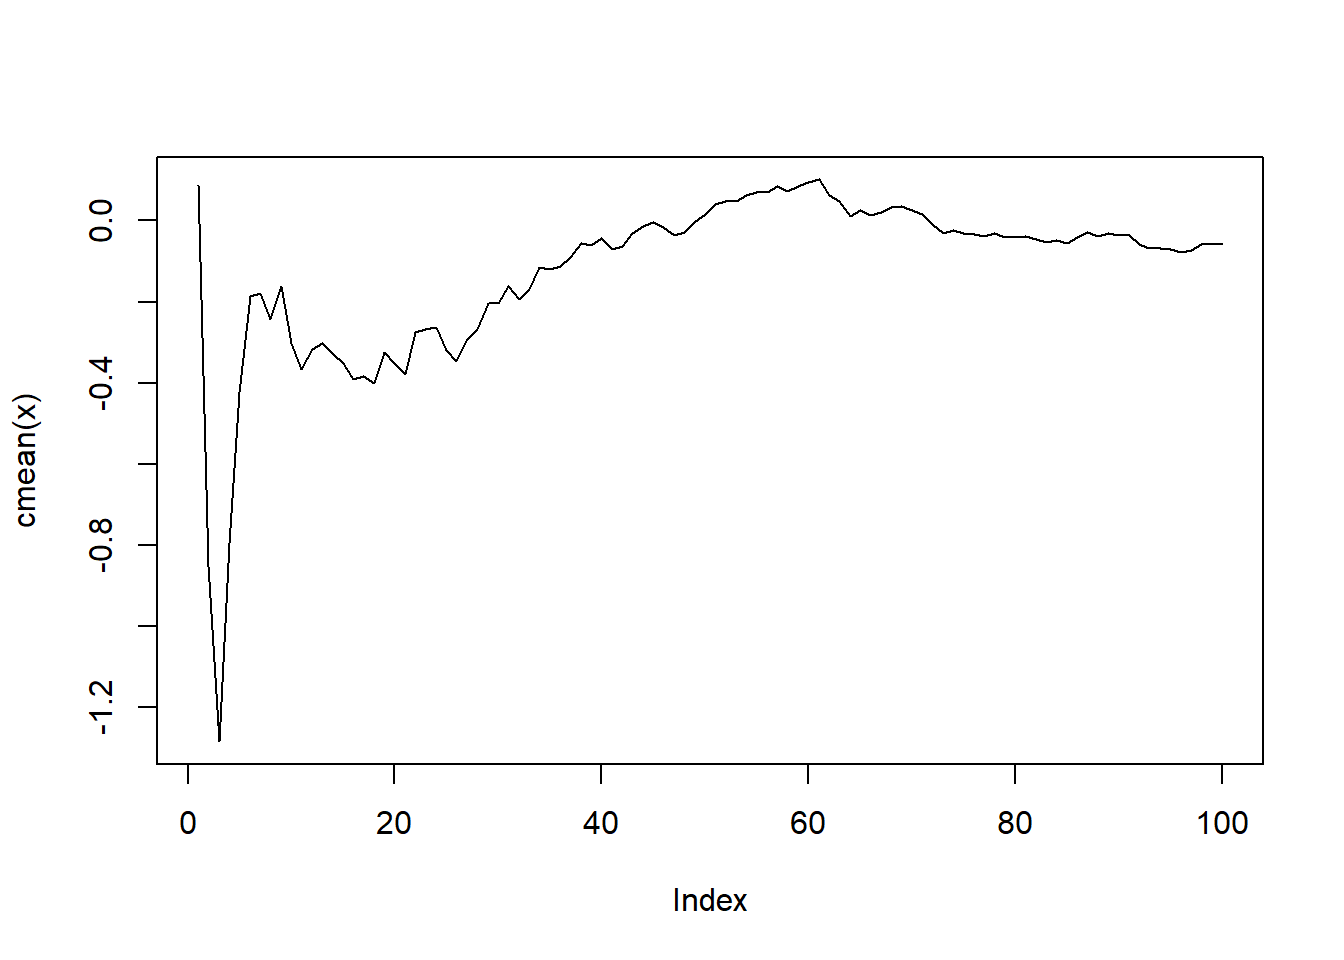
[1] 0.08835903 -1.79153379 -2.15010900 0.67344844 1.06125849 0.99848796Now that we have our list object let’s go ahead and plot the values out after we pass the data through cmean().
library(purrr)

my_list |>
  map(\(x) x |> cmean() |> plot(type = "l"))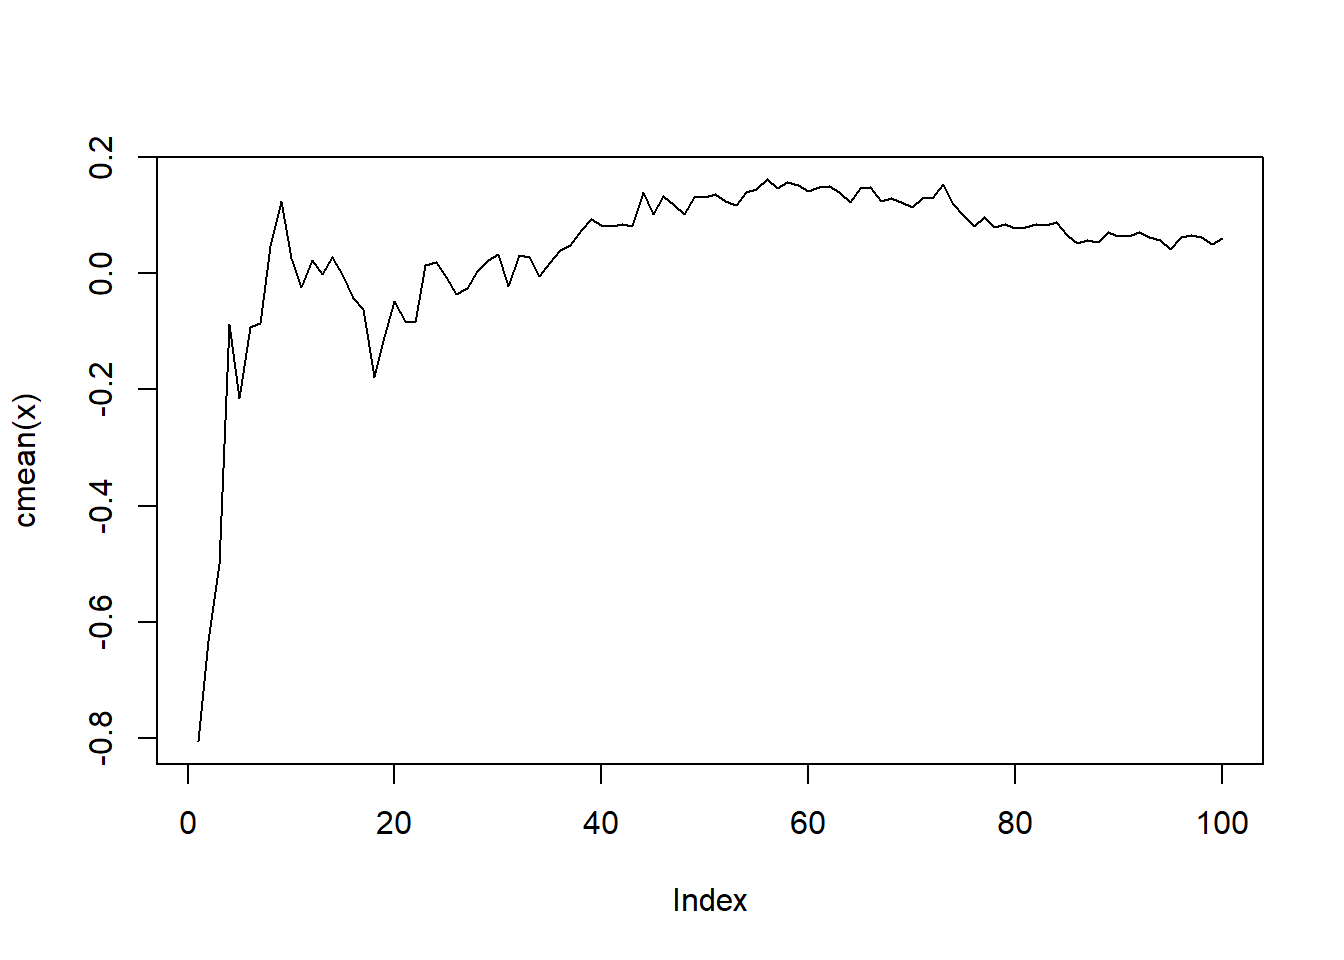
[[1]]
NULL

[[2]]
NULL

[[3]]
NULL

[[4]]
NULL

[[5]]
NULL
From here I think it is easy to see how one could do this on gruoped data as well with dplyr’s group_by().