# Install development version from GitHub
devtools::install_github('R-package/styledTables', build_vignettes = TRUE)Introduction
In the analytics realm whether some like it or not, Excel is huge and maybe King. This is due to the fact of the shear volume of people using it. Microsoft has positioned Excel well in this situation, but, that does not mean we cannot extend Excel with R. In fact we can do just that. I will be focusing new posts on this topic as I gear up to collaborate on a new project focusing on this issue.
For this post we are going to discuss the {styledTable} R package that can be installed from GitHub. Here are a few ways in which the styledTable package can help.
Creating visually appealing tables: Excel is a powerful tool for data analysis and visualization, but it can be limited in terms of formatting options. With the ‘styledtable’ package, users can create tables with a wide range of formatting options, such as bold text, colored cells, and borders. This can make the tables more visually appealing and easier to read, which can be helpful when presenting data to others.
Automating data analysis: The ‘styledtable’ package can be used in combination with other R packages to automate data analysis tasks. For example, users can use R to clean and transform data, and then use the ‘styledtable’ package to create formatted tables for reporting or sharing with others. This can save time and reduce errors associated with manual data entry and formatting.
Integrating with other R packages: R has a large ecosystem of packages for data analysis, visualization, and reporting. The ‘styledtable’ package can be used in conjunction with other R packages to extend the functionality of Excel. For example, users can use R to perform statistical analysis on data, and then use the ‘styledtable’ package to create formatted tables for reporting the results in Excel.
Facilitating collaboration: Sharing Excel files can be challenging when working with multiple users or teams. With the ‘styledtable’ package, users can export styled tables to Excel format, which can be shared with others. This can facilitate collaboration and streamline the process of sharing data and analysis results.
The styledtable package in R, which allows users to create styled tables in R Markdown documents. The package can help to create tables with various formatting options such as bold text, colored cells, and borders. It also has functionality on how to port these to Excel itself.
The package offers a simple syntax that allows users to specify formatting options using HTML and CSS. The resulting table can be customized by changing the CSS file or by using the ‘styler’ function to apply custom styles to individual cells or rows.
Overall, the styledtable package provides a useful tool for creating visually appealing tables in R Markdown documents, and the ability to export these tables to Excel format makes it easier to share and analyze data with others.
Examples
library(styledTables)
library(dplyr)
library(xlsx)

df <- mtcars |>
  select(mpg, cyl, am)

df
mpg cyl am
Mazda RX4 21.0 6 1
Mazda RX4 Wag 21.0 6 1
Datsun 710 22.8 4 1
Hornet 4 Drive 21.4 6 0
Hornet Sportabout 18.7 8 0
Valiant 18.1 6 0
Duster 360 14.3 8 0
Merc 240D 24.4 4 0
Merc 230 22.8 4 0
Merc 280 19.2 6 0
Merc 280C 17.8 6 0
Merc 450SE 16.4 8 0
Merc 450SL 17.3 8 0
Merc 450SLC 15.2 8 0
Cadillac Fleetwood 10.4 8 0
Lincoln Continental 10.4 8 0
Chrysler Imperial 14.7 8 0
Fiat 128 32.4 4 1
Honda Civic 30.4 4 1
Toyota Corolla 33.9 4 1
Toyota Corona 21.5 4 0
Dodge Challenger 15.5 8 0
AMC Javelin 15.2 8 0
Camaro Z28 13.3 8 0
Pontiac Firebird 19.2 8 0
Fiat X1-9 27.3 4 1
Porsche 914-2 26.0 4 1
Lotus Europa 30.4 4 1
Ford Pantera L 15.8 8 1
Ferrari Dino 19.7 6 1
Maserati Bora 15.0 8 1
Volvo 142E 21.4 4 1Ok, now we have our data that we are going to work with, so let’s check out some features.
First we will just apply the styled_table() function and inspect the output.
stl_df <- df |>
  styled_table(keep_header = TRUE)

class(stl_df)
[1] "StyledTable"
attr(,"package")
[1] "styledTables"Now let’s apply some simple formatting.
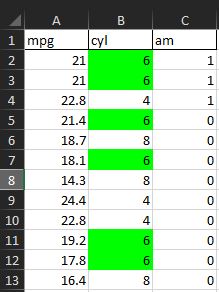
stl_df <- stl_df |>
  set_border_position("all", row_id = 1) |>
  set_bold(row_id = 1) |>
  set_fill_color("#00FF00", col_id = 2, condition = X == "6")
Write out to excel.
wb <- createWorkbook()
sheet <- createSheet(wb, "mtcars_tbl")

# Insert table
write_excel(sheet, stl_df)

# Save workbook
saveWorkbook(wb, "test.xlsx")
Here is the test output: