# Define UI
ui <- fluidPage(
  titlePanel("TidyDensity App"),
  sidebarLayout(
    sidebarPanel(
      selectInput(inputId = "functions",
                  label = "Select Function",
                  choices = c(
                    "tidy_normal",
                    "tidy_bernoulli",
                    "tidy_beta",
                    "tidy_gamma"
                  )
      ),
      numericInput(inputId = "num_sims",
                   label = "Number of simulations:",
                   value = 1,
                   min = 1,
                   max = 15),
      numericInput(inputId = "n",
                   label = "Sample size:",
                   value = 50,
                   min = 30,
                   max = 200),
      selectInput(inputId = "plot_type",
                  label = "Select plot type",
                  choices = c(
                    "density",
                    "quantile",
                    "probability",
                    "qq",
                    "mcmc"
                  )
      ),
      # Download the data
      downloadButton(outputId = "download_data", label = "Download Data")
    ),
    mainPanel(
      plotOutput("density_plot"),
      DT::dataTableOutput("data_table")
    )
  )
)Introduction
In the previous post we allowed users to choose a distribution and a plot type. Now, we want to allow users to download a .csv file of the data that is generated.
In the UI, we added a downloadButton with outputId = "download_data" and label = "Download Data". In the server, we added a downloadHandler that takes a filename and content function. The filename function returns the name of the file to be downloaded (in this case, we used the selected function name as the file name with “.csv” extension). The content function writes the reactive data to a CSV file using the write.csv function. The downloadHandler returns the file to be downloaded when the button is clicked.
See here: 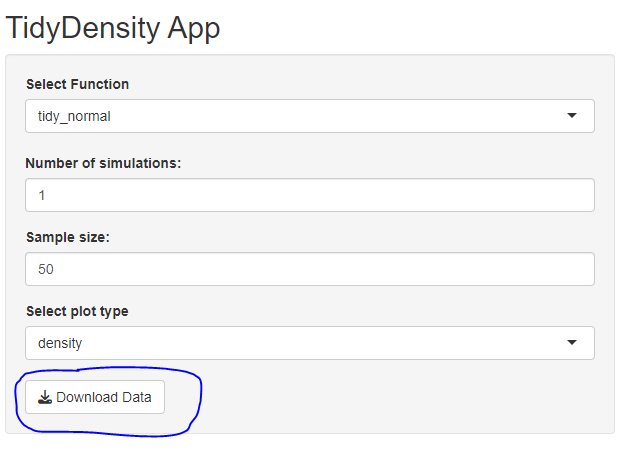
UI Section
Here is the update to the UI Section
Server Section
Here is the update to the Server section.
# Define server
server <- function(input, output) {

  # Create reactive data
  data <- reactive({
    # Call selected function with user input
    match.fun(input$functions)(.num_sims = input$num_sims, .n = input$n)
  })

  # Create density plot
  output$density_plot <- renderPlot({
    # Call autoplot on reactive data
    p <- data() |>
      tidy_autoplot(.plot_type = input$plot_type)

    print(p)
  })

  # Create data table
  output$data_table <- DT::renderDataTable({
    # Return reactive data as a data table
    DT::datatable(data())
  })

  # Download data handler
  output$download_data <- downloadHandler(
    filename = function() {
      paste0(input$functions, ".csv")
    },
    content = function(file) {
      write.csv(data(), file, row.names = FALSE)
    }
  )

}

# Run the app
shinyApp(ui = ui, server = server)
Conclusion
With these changes, the user can now export the data to a .csv file by clicking the “Export Data” button and selecting where to save the file.
I hope this update to the TidyDensity app will make it more useful for your data analysis needs. If you have any questions or feedback, please feel free to let me know, and as usual…Steal this Code!! Modify for yourself and see what you come up with.
Here is the entire script:
library(shiny)
library(TidyDensity)
library(tidyverse)
library(DT)

# Define UI
ui <- fluidPage(
  titlePanel("TidyDensity App"),
  sidebarLayout(
    sidebarPanel(
      selectInput(inputId = "functions",
                  label = "Select Function",
                  choices = c(
                    "tidy_normal",
                    "tidy_bernoulli",
                    "tidy_beta",
                    "tidy_gamma"
                  )
      ),
      numericInput(inputId = "num_sims",
                   label = "Number of simulations:",
                   value = 1,
                   min = 1,
                   max = 15),
      numericInput(inputId = "n",
                   label = "Sample size:",
                   value = 50,
                   min = 30,
                   max = 200),
      selectInput(inputId = "plot_type",
                  label = "Select plot type",
                  choices = c(
                    "density",
                    "quantile",
                    "probability",
                    "qq",
                    "mcmc"
                  )
      ),
      downloadButton(outputId = "download_data", label = "Download Data")
    ),
    mainPanel(
      plotOutput("density_plot"),
      DT::dataTableOutput("data_table")
    )
  )
)

# Define server
server <- function(input, output) {

  # Create reactive data
  data <- reactive({
    # Call selected function with user input
    match.fun(input$functions)(.num_sims = input$num_sims, .n = input$n)
  })

  # Create density plot
  output$density_plot <- renderPlot({
    # Call autoplot on reactive data
    p <- data() |>
      tidy_autoplot(.plot_type = input$plot_type)

    print(p)
  })

  # Create data table
  output$data_table <- DT::renderDataTable({
    # Return reactive data as a data table
    DT::datatable(data())
  })

  # Download data handler
  output$download_data <- downloadHandler(
    filename = function() {
      paste0(input$functions, ".csv")
    },
    content = function(file) {
      write.csv(data(), file, row.names = FALSE)
    }
  )

}

# Run the app
shinyApp(ui = ui, server = server)
Voila!