Create ggplot2 plot of regression predictions
Source:R/plot-regression-predictions.R
plot_regression_predictions.RdCreate a ggplot2 plot of regression predictions.
Arguments
- .data
The data from the output of the
extract_wflw_pred()function.- .output
The default is "list" which will return a list of plots. The other option is "facet" which will return a single faceted plot.
Details
Create a ggplot2 plot of regression predictions, the actual, training,
and testing values. The output of this function can either be a list of plots
or a single faceted plot. This function takes the output of the function
extract_wflw_pred() function.
See also
Other Plotting:
plot_regression_residuals()
Examples
library(recipes)
rec_obj <- recipe(mpg ~ ., data = mtcars)
frt_tbl <- fast_regression(
mtcars,
rec_obj,
.parsnip_eng = c("lm","glm"),
.parsnip_fns = "linear_reg"
)
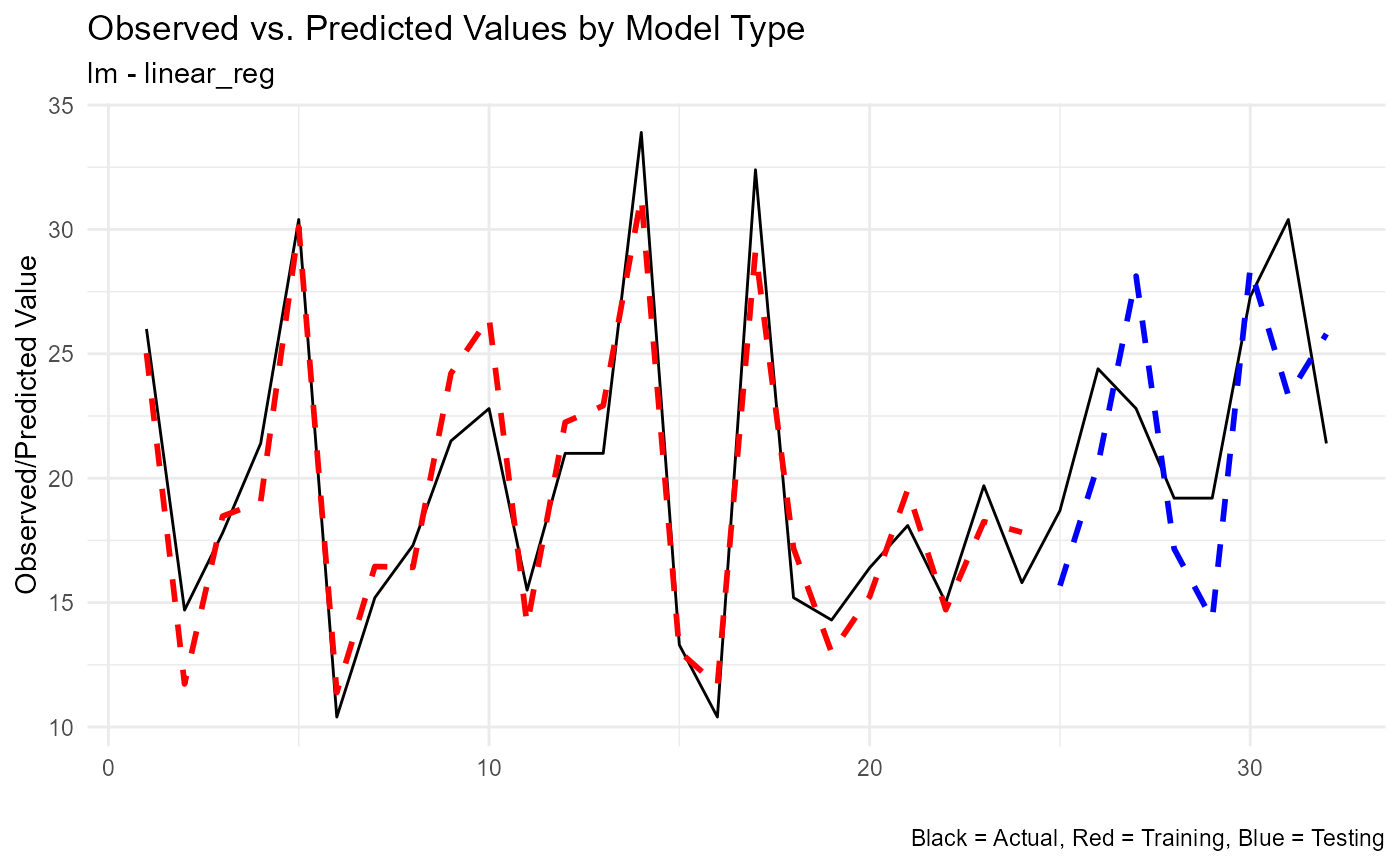
extract_wflw_pred(frt_tbl,1) |> plot_regression_predictions()
#> [[1]]
#> Warning: Removed 32 rows containing missing values or values outside the scale range
#> (`geom_line()`).
#> Warning: Removed 40 rows containing missing values or values outside the scale range
#> (`geom_line()`).
#> Warning: Removed 56 rows containing missing values or values outside the scale range
#> (`geom_line()`).
 #>
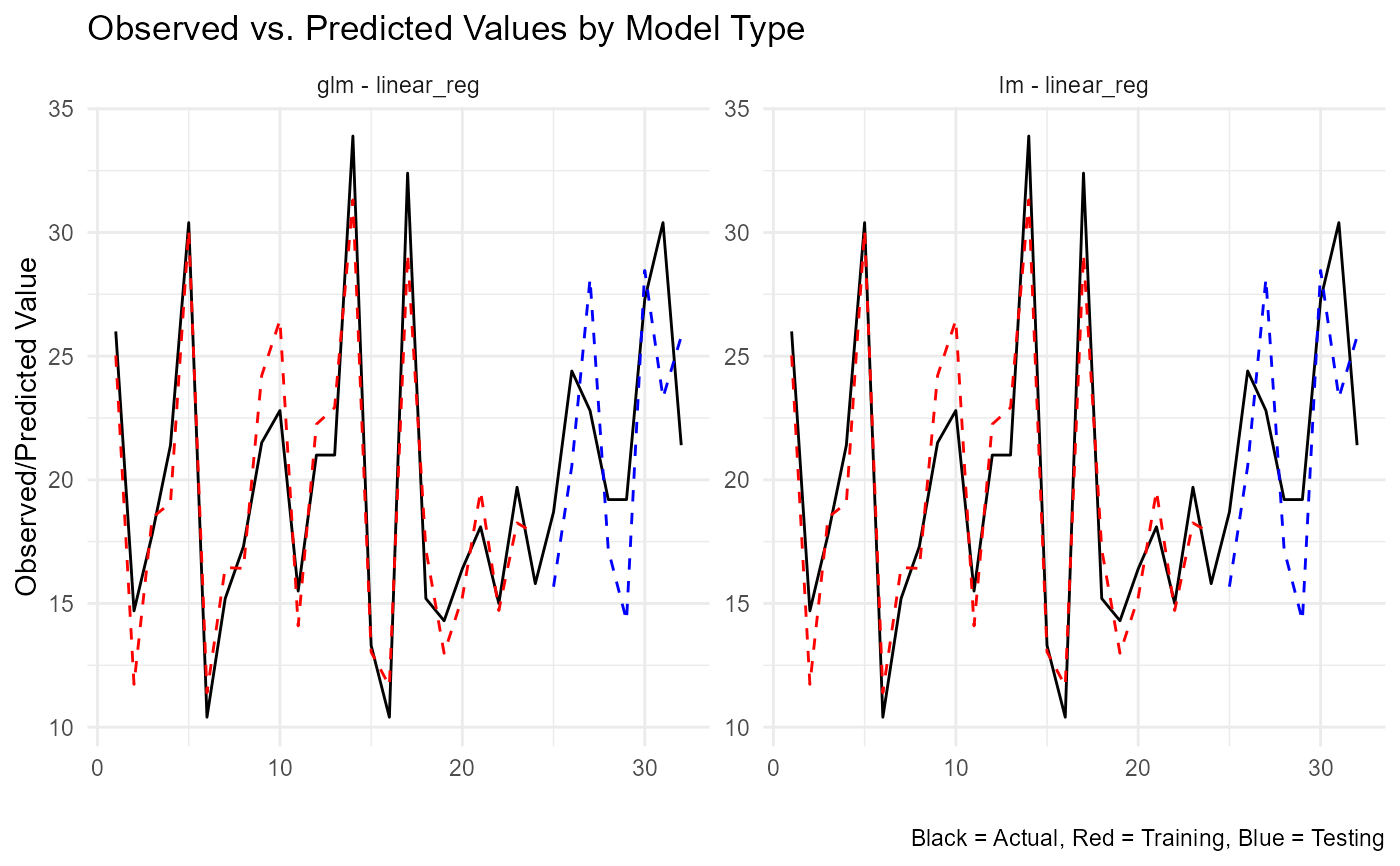
extract_wflw_pred(frt_tbl,1:nrow(frt_tbl)) |>
plot_regression_predictions(.output = "facet")
#>
extract_wflw_pred(frt_tbl,1:nrow(frt_tbl)) |>
plot_regression_predictions(.output = "facet")