Create ggplot2 plot of regression residuals
Source:R/plot-regression-residuals.R
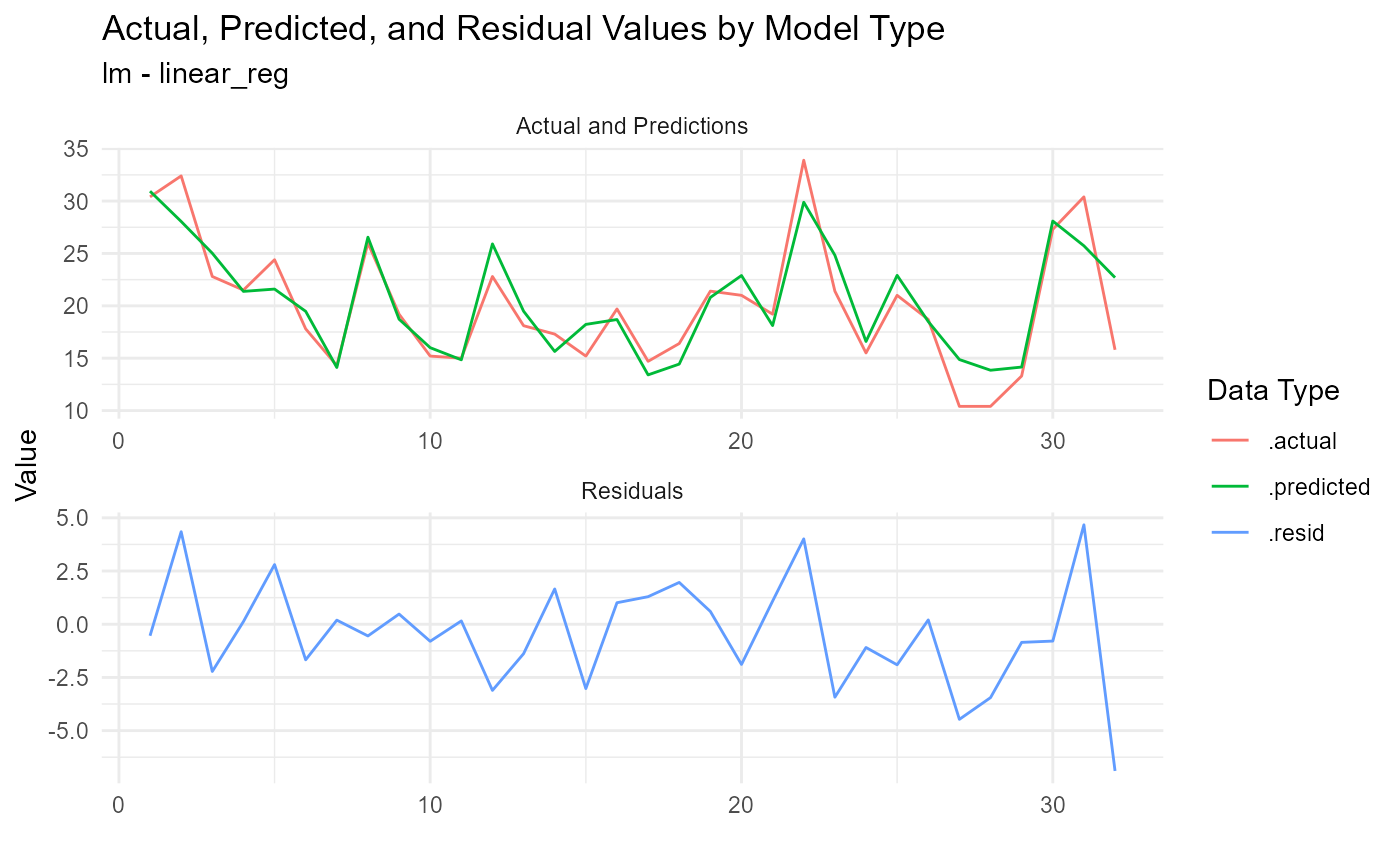
plot_regression_residuals.RdCreate a ggplot2 plot of regression residuals.
Arguments
- .data
The data from the output of the
extract_regression_residuals()function.
Details
Create a ggplot2 plot of regression residuals. The output of this
function can either be a list of plots or a single faceted plot. This function
takes the output of the extract_regression_residuals() function.
See also
Other Plotting:
plot_regression_predictions()
Examples
library(recipes)

rec_obj <- recipe(mpg ~ ., data = mtcars)
frt_tbl <- fast_regression(
  mtcars,
  rec_obj,
  .parsnip_eng = c("lm","glm"),
  .parsnip_fns = "linear_reg"
  )

extract_regression_residuals(frt_tbl, FALSE)[1] |> plot_regression_residuals()
#> [[1]]

#>
extract_regression_residuals(frt_tbl, TRUE)[1] |> plot_regression_residuals()
#> [[1]]

#>
extract_regression_residuals(frt_tbl, TRUE)[1] |> plot_regression_residuals()
#> [[1]]
 #>
#>