This function generates a probability density function (PDF) plot for the triangular distribution.
Value
The function returns a ggplot2 object representing the probability density function plot for the triangular distribution.
Details
The function checks if the input data is a data frame or tibble, and if it comes from the tidy_triangular
function. It then extracts necessary attributes for the plot and creates a PDF plot using ggplot2. The plot
includes data points and segments to represent the triangular distribution.
Examples
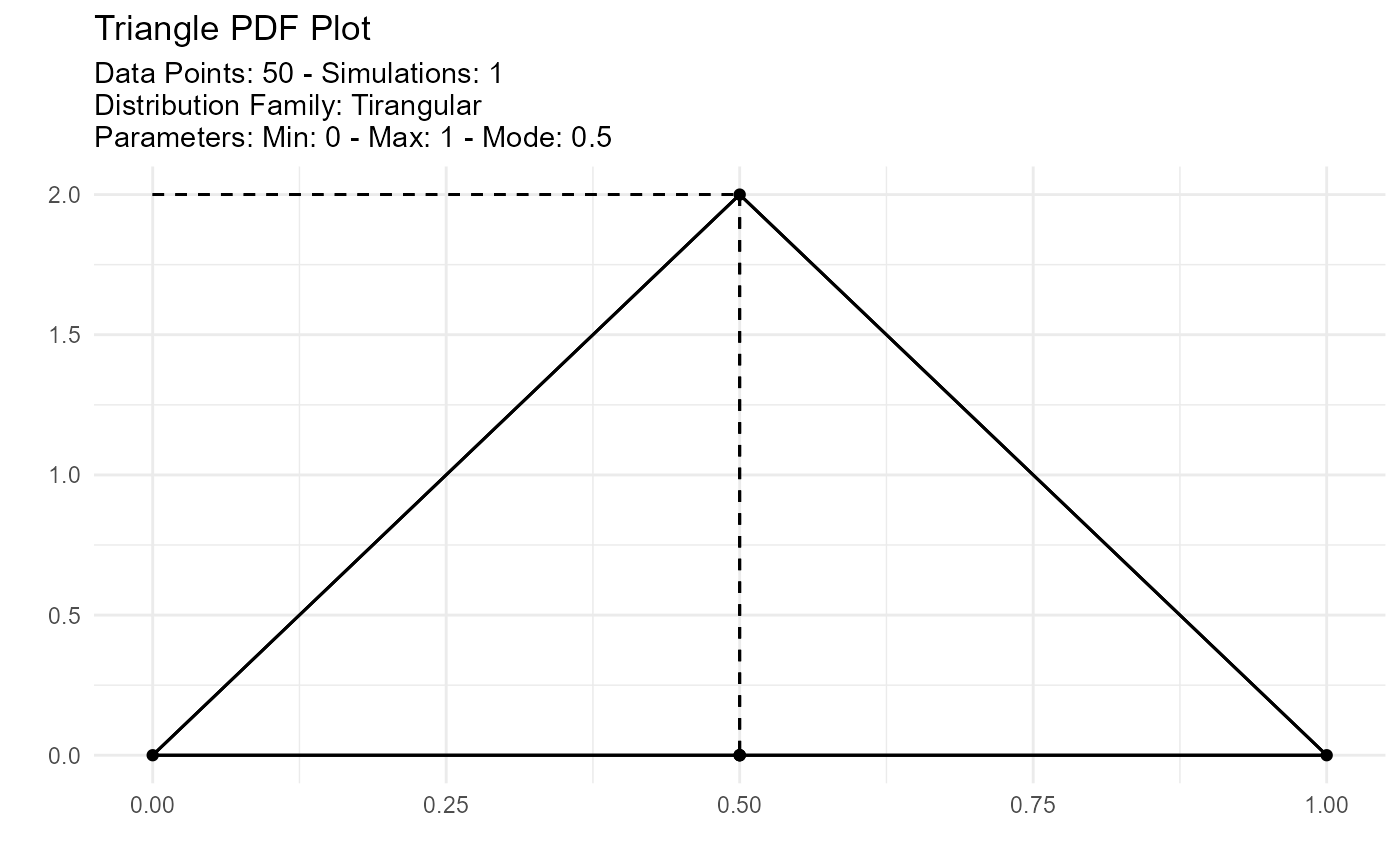
# Example: Generating a PDF plot for the triangular distribution
data <- tidy_triangular(.n = 50, .min = 0, .max = 1, .mode = 1/2, .num_sims = 1,
.return_tibble = TRUE)
triangle_plot(data)
#> Warning: All aesthetics have length 1, but the data has 3 rows.
#> ℹ Please consider using `annotate()` or provide this layer with data containing
#>   a single row.
#> Warning: All aesthetics have length 1, but the data has 3 rows.
#> ℹ Please consider using `annotate()` or provide this layer with data containing
#>   a single row.
#> Warning: All aesthetics have length 1, but the data has 3 rows.
#> ℹ Please consider using `annotate()` or provide this layer with data containing
#>   a single row.
#> Warning: All aesthetics have length 1, but the data has 3 rows.
#> ℹ Please consider using `annotate()` or provide this layer with data containing
#>   a single row.
#> Warning: All aesthetics have length 1, but the data has 3 rows.
#> ℹ Please consider using `annotate()` or provide this layer with data containing
#>   a single row.
#> Warning: All aesthetics have length 1, but the data has 3 rows.
#> ℹ Please consider using `annotate()` or provide this layer with data containing
#>   a single row.