Perform an fft using stats::fft() and return a tidier style output list with plots.
Usage
tidy_fft(
  .data,
  .date_col,
  .value_col,
  .frequency = 12L,
  .harmonics = 1L,
  .upsampling = 10L
)
Arguments
- .data
The data.frame/tibble you will pass for analysis.
- .date_col
The column that holds the date.
- .value_col
The column that holds the data to be analyzed.
- .frequency
The frequency of the data, 12 = monthly for example.
- .harmonics
How many harmonic waves do you want to produce.
- .upsampling
The up sampling of the time series.
Details
This function will perform a few different things, but primarily it will
compute the Fast Discrete Fourier Transform (FFT) using stats::fft(). The
formula is given as:
$$y[h] = sum_{k=1}^n z[k]*exp(-2*pi*1i*(k-1)*(h-1)/n)$$
There are many items returned inside of a list invisibly. There are four primary categories of data returned in the list. Below are the primary categories and the items inside of them.
data:
data
error_data
input_vector
maximum_harmonic_tbl
differenced_value_tbl
dff_tbl
ts_obj
plots:
harmonic_plot
diff_plot
max_har_plot
harmonic_plotly
max_har_plotly
parameters:
harmonics
upsampling
start_date
end_date
freq
model:
m
harmonic_obj
harmonic_model
model_summary
Examples
suppressPackageStartupMessages(library(dplyr))
data_tbl <- AirPassengers %>%
ts_to_tbl() %>%
select(-index)
a <- tidy_fft(
.data = data_tbl,
.value_col = value,
.date_col = date_col,
.harmonics = 3,
.frequency = 12
)
#> Registered S3 methods overwritten by 'TSA':
#> method from
#> fitted.Arima forecast
#> plot.Arima forecast
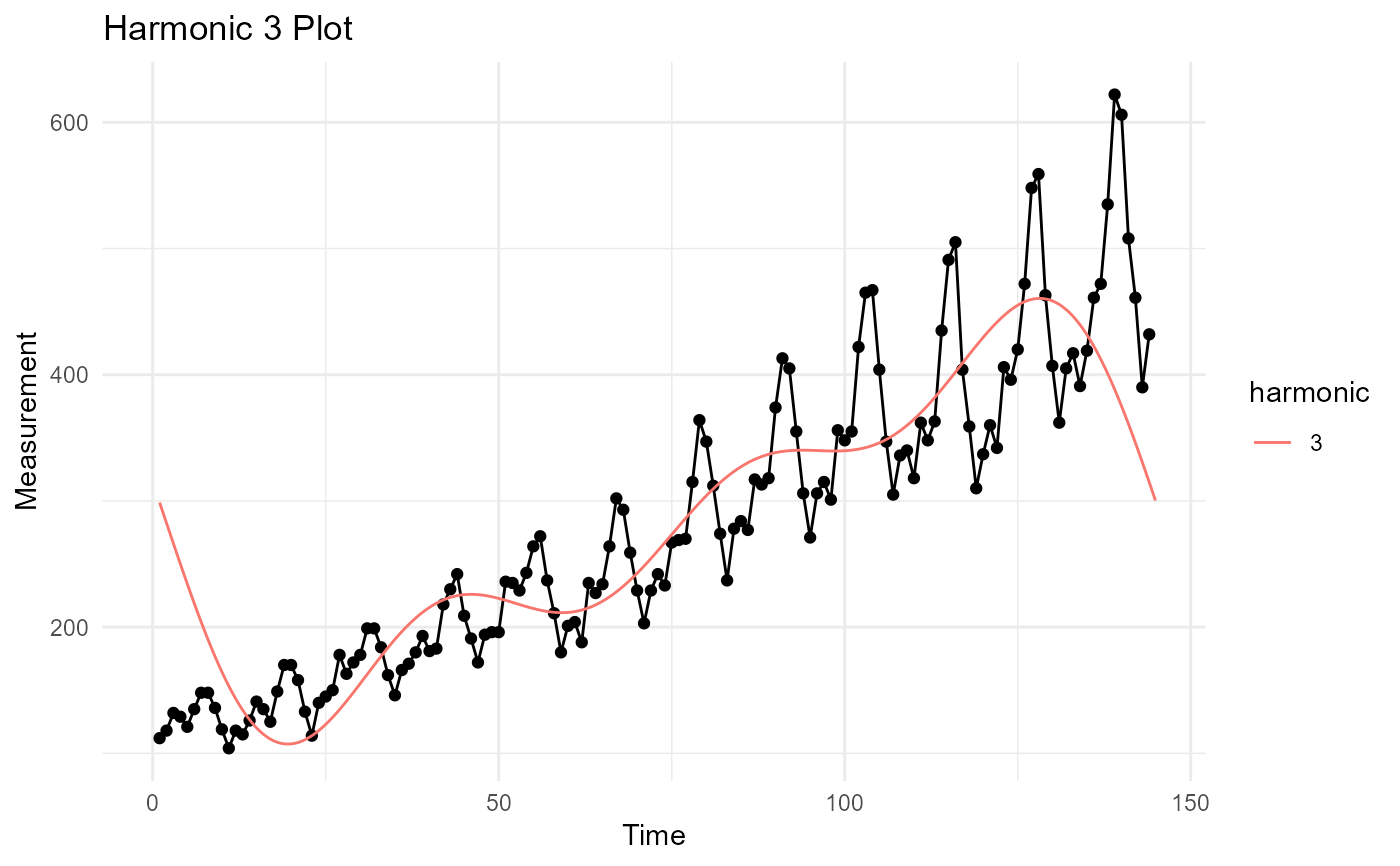
a$plots$max_har_plot
#> Warning: Removed 1296 rows containing missing values or values outside the scale range
#> (`geom_line()`).
#> Warning: Removed 1296 rows containing missing values or values outside the scale range
#> (`geom_point()`).
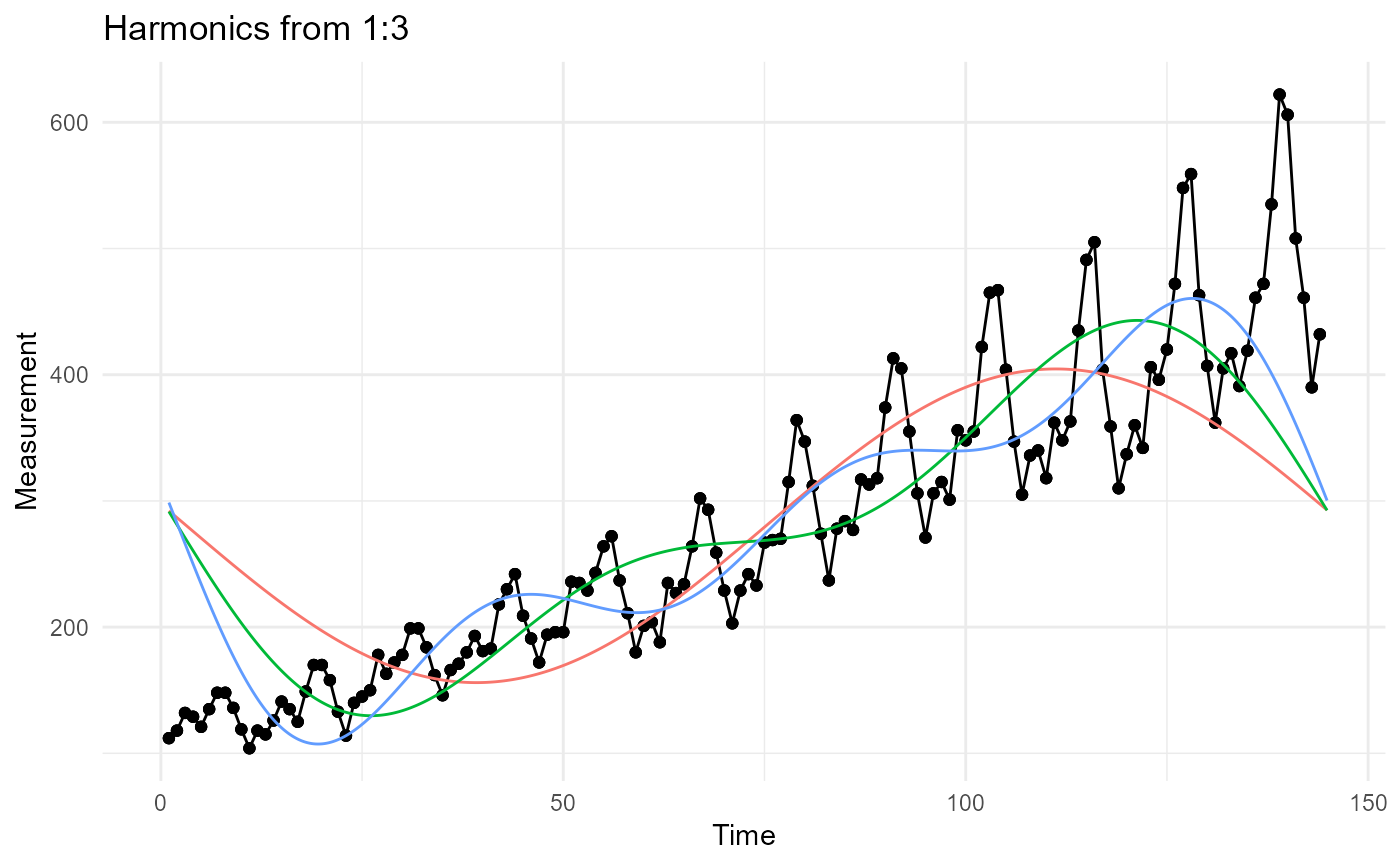
 a$plots$harmonic_plot
#> Warning: Removed 3888 rows containing missing values or values outside the scale range
#> (`geom_line()`).
#> Warning: Removed 3888 rows containing missing values or values outside the scale range
#> (`geom_point()`).
a$plots$harmonic_plot
#> Warning: Removed 3888 rows containing missing values or values outside the scale range
#> (`geom_line()`).
#> Warning: Removed 3888 rows containing missing values or values outside the scale range
#> (`geom_point()`).