Introducing plot_regression_residuals() from tidyAML: Unveiling the Power of Visualizing Regression Residuals
tidyaml
rtip
data-analysis
data-science
Author
Steven P. Sanderson II, MPH
Published
March 18, 2024
Introduction
Greetings, fellow R enthusiasts! Today, we’re diving into the depths of tidyAML, specifically exploring a new gem in its arsenal: plot_regression_residuals(). Strap in as we embark on a journey to unravel the mysteries of regression residuals and witness how this function revolutionizes the way we visualize and understand our regression models.
Understanding the Essence of Regression Residuals
Before we delve into the intricacies of plot_regression_residuals(), let’s take a moment to appreciate the significance of regression residuals. In the realm of statistical modeling, residuals are like breadcrumbs left behind by our regression models. They represent the discrepancies between observed and predicted values, serving as crucial indicators of model performance and areas for improvement.
Unveiling the Functionality
At its core, plot_regression_residuals() is designed to provide us with intuitive visualizations of regression residuals. Armed with the output from extract_regression_residuals(), this function empowers us to generate insightful ggplot2 plots effortlessly.
Syntax Demystified
The syntax of plot_regression_residuals() is elegantly simple:
plot_regression_residuals(.data)
Here, .data refers to the data extracted from the output of extract_regression_residuals(). It’s like feeding the function with the raw material it needs to work its magic.
Bringing Theory to Life: An Example
Let’s put theory into practice with a hands-on example:
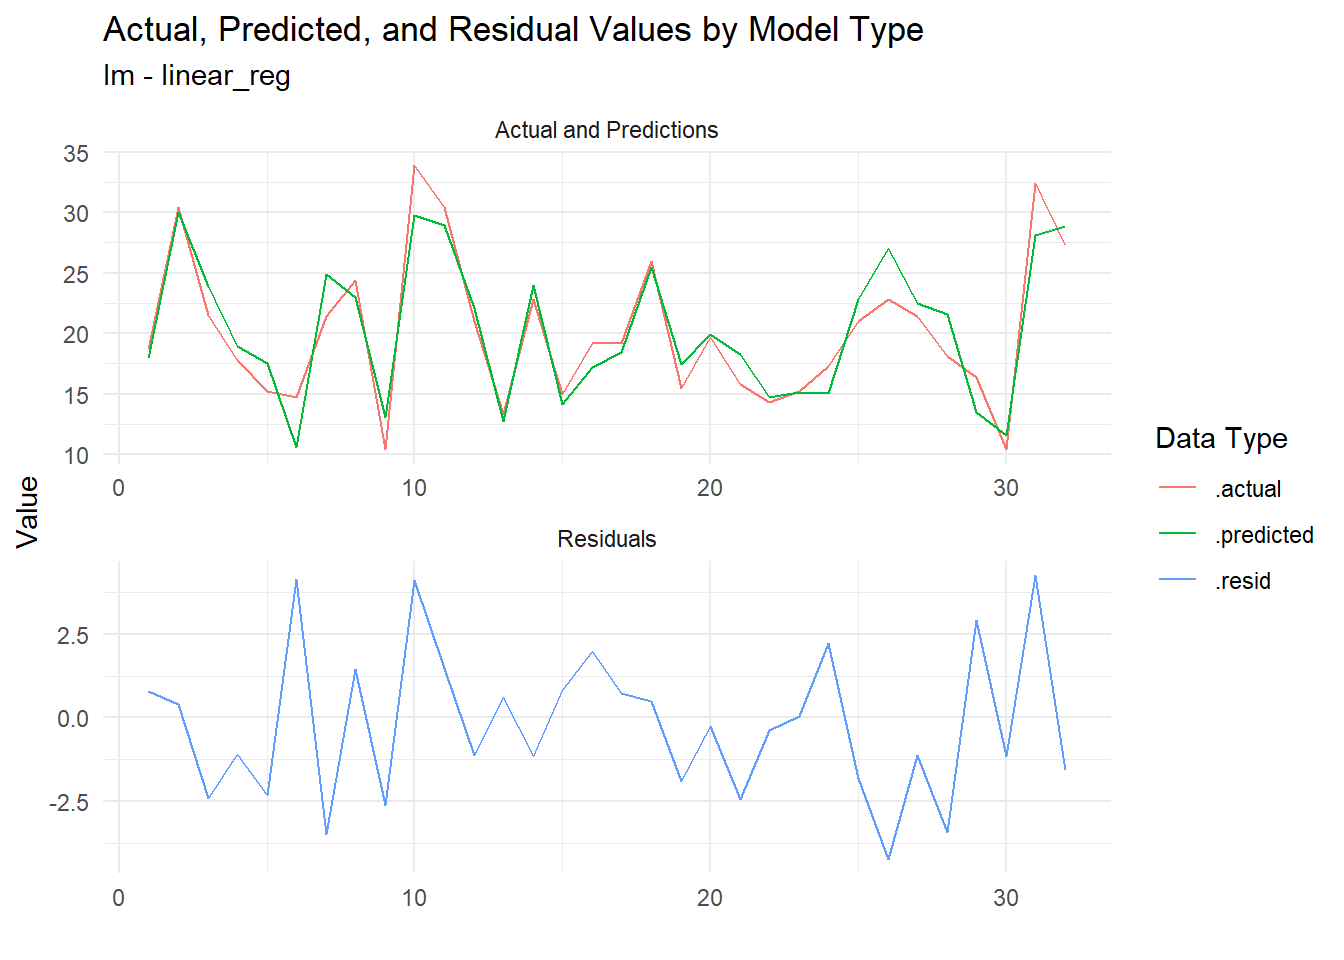
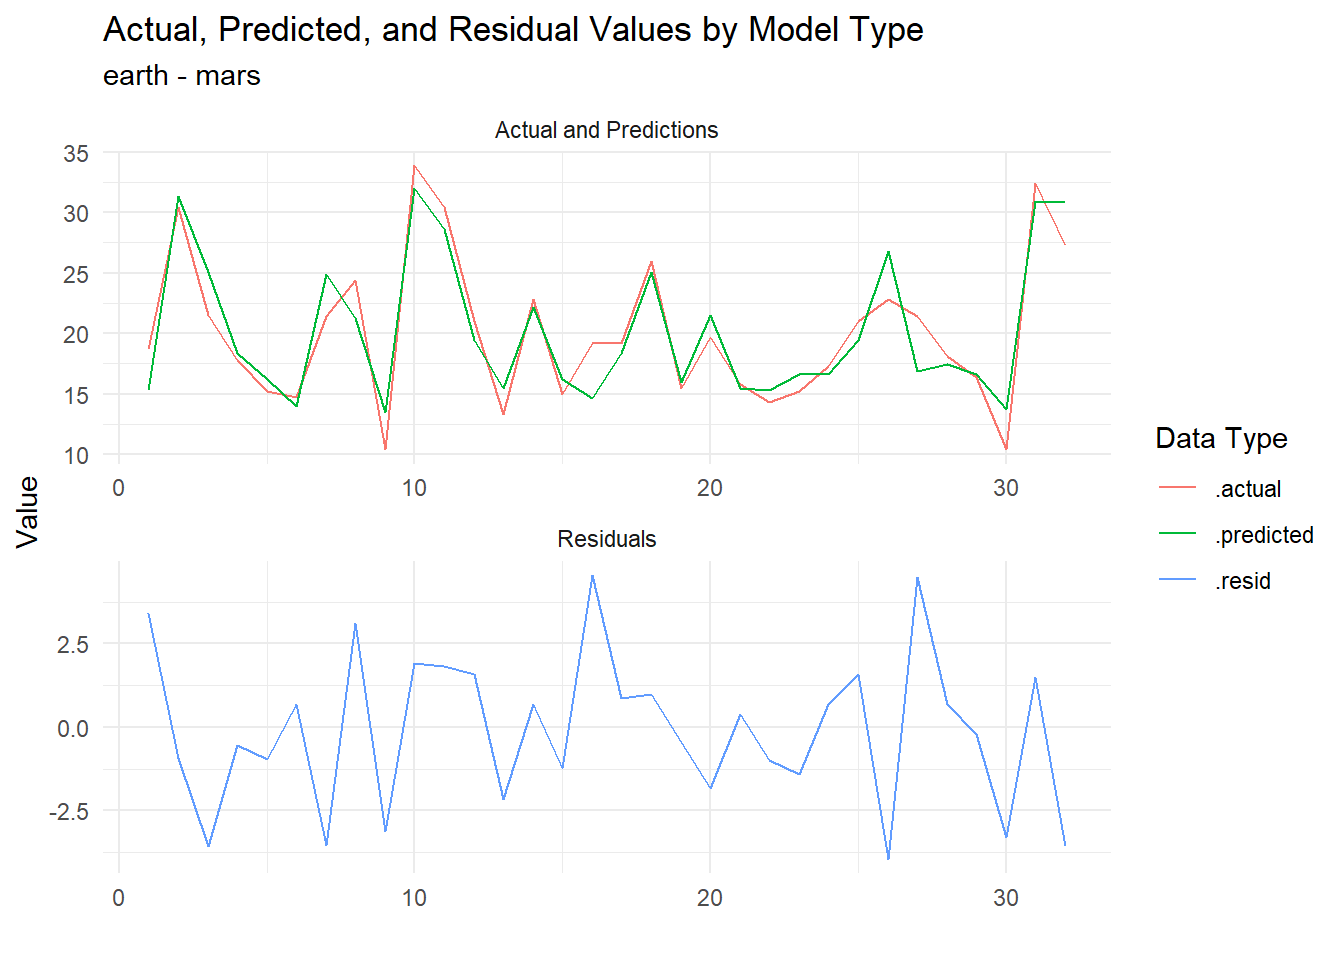
library(tidyAML)library(recipes)library(earth)# Create a reciperec_obj <-recipe(mpg ~ ., data = mtcars)# Perform fast regressionfrt_tbl <-fast_regression( mtcars, rec_obj,.parsnip_eng =c("lm","glm","earth"),.parsnip_fns =c("linear_reg","mars"))# Extract regression residuals and plotextract_regression_residuals(frt_tbl, FALSE) |>plot_regression_residuals()
[[1]]
[[2]]
[[3]]
In this snippet, we prepare our data with a recipe, perform fast regression, extract the residuals, and finally, visualize them using plot_regression_residuals(). It’s like crafting a masterpiece with just a few strokes of the keyboard.
Unlocking Insights with Visualization
What makes plot_regression_residuals() truly remarkable is its ability to unlock hidden insights within our data. With a single function call, we can uncover patterns, detect outliers, and assess the homoscedasticity of our model—all through the lens of beautifully crafted plots.
Conclusion: Empowering Data Exploration
As we draw the curtains on our exploration of plot_regression_residuals(), it’s evident that tidyAML continues to push the boundaries of data exploration and analysis. By democratizing the visualization of regression residuals, this function empowers R users of all skill levels to gain deeper insights into their models and make more informed decisions.
So, next time you find yourself knee-deep in regression analysis, remember the power that lies within plot_regression_residuals(). With just a single function call, you can transform raw residuals into actionable insights, propelling your data analysis journey to new heights.
To dive deeper into the world of plot_regression_residuals() and unleash its full potential, check out the official documentation here.
Until next time, happy coding and may your residuals always lead you to new discoveries!