ts_random_walk(
  .mean = 0,
  .sd = 0.1,
  .num_walks = 100,
  .periods = 100,
  .initial_value = 1000
)Introduction
Generating random walk data for timesieries analysis does not have to be difficult, and in fact is not. It can be generated for multiple simulations and have a tidy output. How? ts_random_walk() from the {healthyR.ts} package. Let’s take a look at the function.
Function
Here is the full function call.
Now let’s look at the arguments to the parameters.
.mean- The desired mean of the random walks.sd- The standard deviation of the random walks.num_walks- The number of random walks you want generated.periods- The length of the random walk(s) you want generated.initial_value- The initial value where the random walks should start
The underlying data of this function is generated by rnorm()
Example
Let’s take a look at an example and see some visuals.
library(healthyR.ts)
library(ggplot2)

df <- ts_random_walk(.num_walks = 100)

df
# A tibble: 10,000 × 4
run x y cum_y
<dbl> <dbl> <dbl> <dbl>
1 1 1 -0.144 856.
2 1 2 0.00648 862.
3 1 3 0.0726 924.
4 1 4 -0.152 784.
5 1 5 0.0228 802.
6 1 6 -0.0455 765.
7 1 7 0.0972 840.
8 1 8 -0.234 643.
9 1 9 -0.0501 611.
10 1 10 -0.0358 589.
# … with 9,990 more rowsThere are attributes attached to the output of this function, let’s see what they are.
atb <- attributes(df)

names_to_print <- names(atb)[which(names(atb) != "row.names")]

atb[names_to_print]
$class
[1] "tbl_df" "tbl" "data.frame"
$names
[1] "run" "x" "y" "cum_y"
$.mean
[1] 0
$.sd
[1] 0.1
$.num_walks
[1] 100
$.periods
[1] 100
$.initial_value
[1] 1000Now lets visualize.
df %>%
   ggplot(
       mapping = aes(
           x = x
           , y = cum_y
           , color = factor(run)
           , group = factor(run)
        )
    ) +
    geom_line(alpha = 0.8) +
    ts_random_walk_ggplot_layers(df)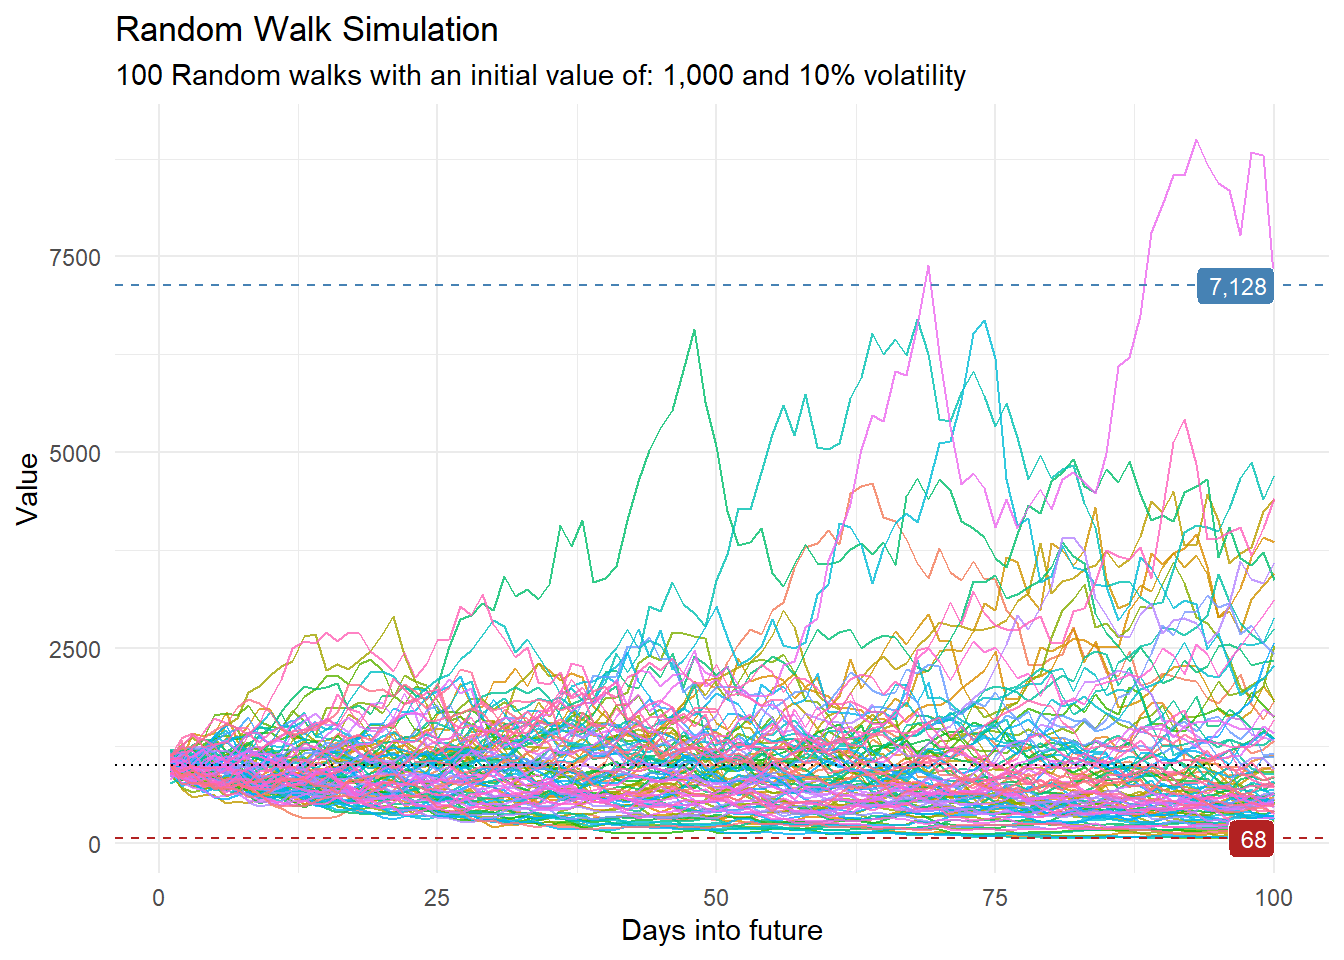
Voila!