Skip to contents

Plot an augmented Geometric/Brownian Motion.

Usage

ts_brownian_motion_plot(.data, .date_col, .value_col, .interactive = FALSE)

Arguments

.data

The data you are going to pass to the function to augment.

.date_col

The column that holds the date

.value_col

The column that holds the value

.interactive

The default is FALSE, TRUE will produce an interactive plotly plot.

Value

A ggplot2 object or an interactive plotly plot

Details

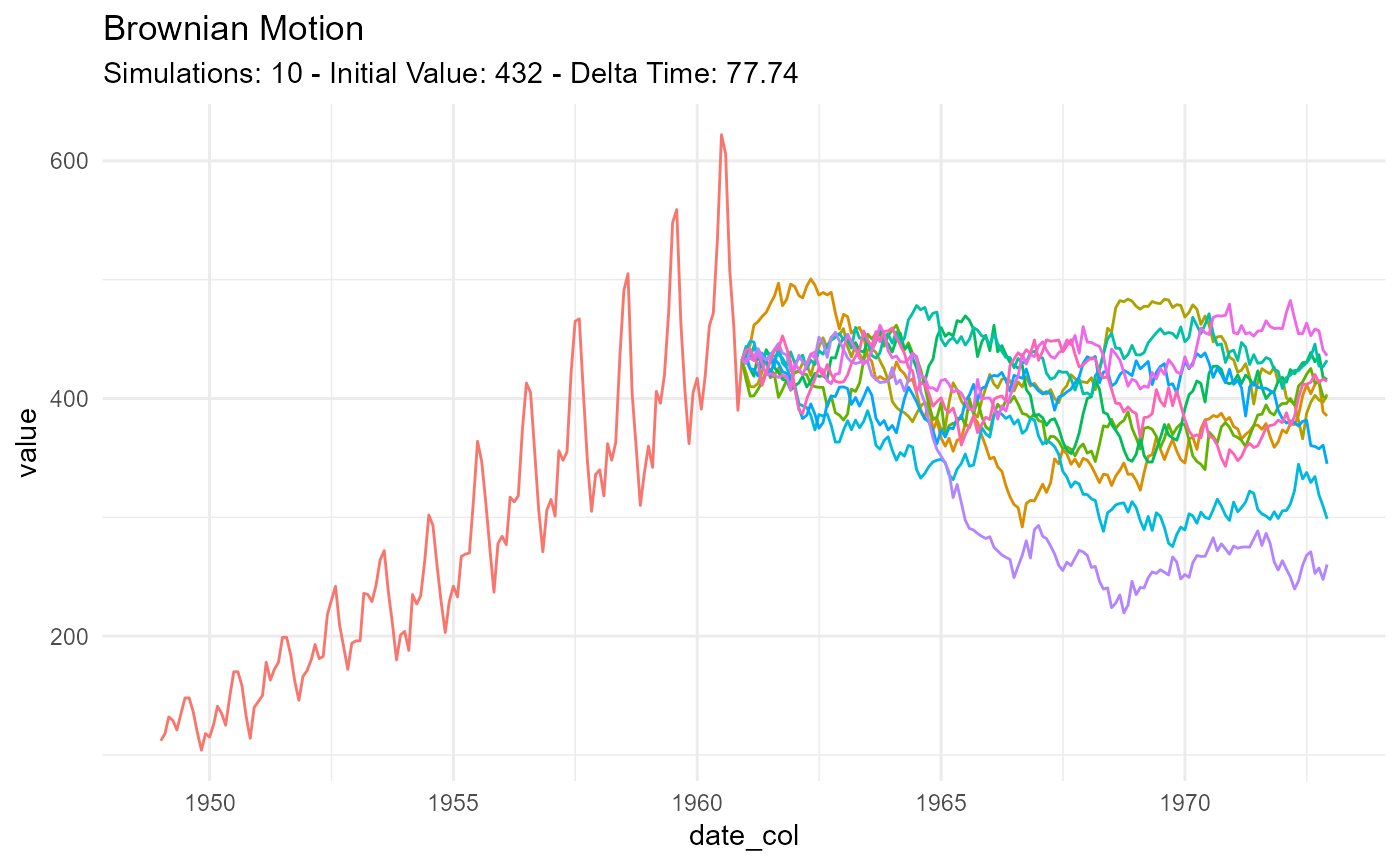
This function will take output from either the ts_brownian_motion_augment() or the ts_geometric_brownian_motion_augment() function and plot them. The legend is set to "none" if the simulation count is higher than 9.

Author

Steven P. Sanderson II, MPH

Examples

library(dplyr)

df <- ts_to_tbl(AirPassengers) %>% select(-index)

augmented_data <- df %>%
  ts_brownian_motion_augment(
    .date_col = date_col,
    .value_col = value,
    .time = 144
  )

 augmented_data %>%
   ts_brownian_motion_plot(.date_col = date_col, .value_col = value)