Estimate Hypergeometric Parameters
Source:R/est-param-hypergeometric.R
util_hypergeometric_param_estimate.RdThis function will attempt to estimate the geometric prob parameter
given some vector of values .x. Estimate m, the number of white balls in
the urn, or m+n, the total number of balls in the urn, for a hypergeometric
distribution.
Usage
util_hypergeometric_param_estimate(
  .x,
  .m = NULL,
  .total = NULL,
  .k,
  .auto_gen_empirical = TRUE
)
Arguments
- .x
A non-negative integer indicating the number of white balls out of a sample of size
.kdrawn without replacement from the urn. You cannot have missing, undefined or infinite values.- .m
Non-negative integer indicating the number of white balls in the urn. You must supply
.mor.total, but not both. You cannot have missing values.- .total
A positive integer indicating the total number of balls in the urn (i.e., m+n). You must supply
.mor.total, but not both. You cannot have missing values.- .k
A positive integer indicating the number of balls drawn without replacement from the urn. You cannot have missing values.
- .auto_gen_empirical
This is a boolean value of TRUE/FALSE with default set to TRUE. This will automatically create the
tidy_empirical()output for the.xparameter and use thetidy_combine_distributions(). The user can then plot out the data using$combined_data_tblfrom the function output.
Details
This function will see if the given vector .x is a numeric integer.
It will attempt to estimate the prob parameter of a geometric distribution.
Missing (NA), undefined (NaN), and infinite (Inf, -Inf) values are not allowed.
Let .x be an observation from a hypergeometric distribution with parameters
.m = M, .n = N, and .k = K. In R nomenclature, .x represents
the number of white balls drawn out of a sample of .k balls drawn without
replacement from an urn containing .m white balls and .n black balls.
The total number of balls in the urn is thus .m + .n. Denote the total
number of balls by T = .m + .n
See also
Other Parameter Estimation:
util_bernoulli_param_estimate(),
util_beta_param_estimate(),
util_binomial_param_estimate(),
util_burr_param_estimate(),
util_cauchy_param_estimate(),
util_chisquare_param_estimate(),
util_exponential_param_estimate(),
util_f_param_estimate(),
util_gamma_param_estimate(),
util_generalized_beta_param_estimate(),
util_generalized_pareto_param_estimate(),
util_geometric_param_estimate(),
util_inverse_burr_param_estimate(),
util_inverse_pareto_param_estimate(),
util_inverse_weibull_param_estimate(),
util_logistic_param_estimate(),
util_lognormal_param_estimate(),
util_negative_binomial_param_estimate(),
util_normal_param_estimate(),
util_paralogistic_param_estimate(),
util_pareto1_param_estimate(),
util_pareto_param_estimate(),
util_poisson_param_estimate(),
util_t_param_estimate(),
util_triangular_param_estimate(),
util_uniform_param_estimate(),
util_weibull_param_estimate(),
util_zero_truncated_binomial_param_estimate(),
util_zero_truncated_geometric_param_estimate(),
util_zero_truncated_negative_binomial_param_estimate(),
util_zero_truncated_poisson_param_estimate()
Other Hypergeometric:
tidy_hypergeometric(),
util_hypergeometric_stats_tbl()
Examples
library(dplyr)
library(ggplot2)
th <- rhyper(10, 20, 30, 5)
output <- util_hypergeometric_param_estimate(th, .total = 50, .k = 5)
output$parameter_tbl
#> # A tibble: 2 × 5
#> dist_type samp_size method m total
#> <chr> <int> <chr> <dbl> <dbl>
#> 1 Hypergeometric 10 EnvStats_MLE 20.4 NA
#> 2 Hypergeometric 10 EnvStats_MVUE 20 50
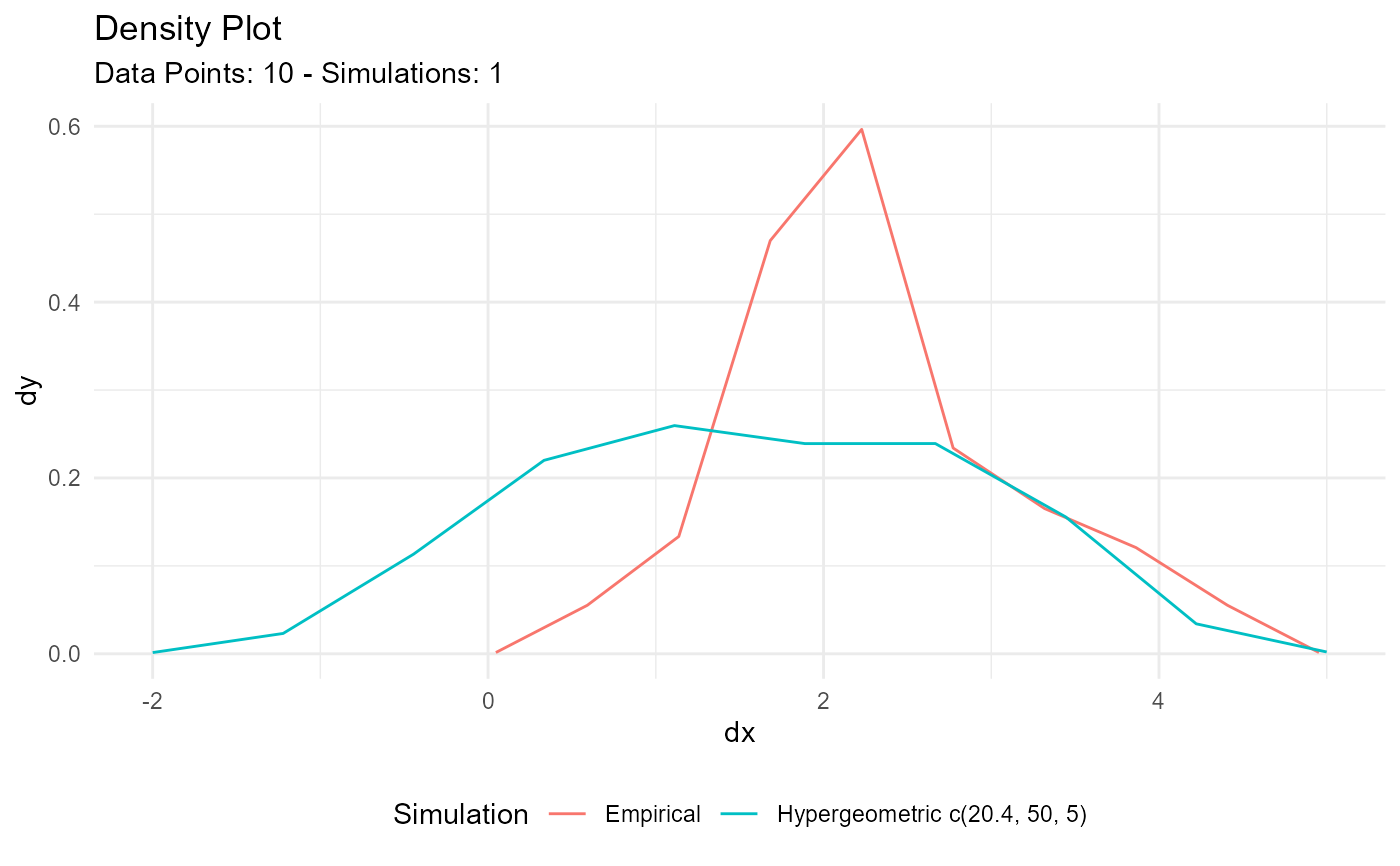
output$combined_data_tbl |>
tidy_combined_autoplot()