This function will attempt to estimate the gamma shape and scale
parameters given some vector of values. The function will return a list output by default, and if the parameter
.auto_gen_empirical is set to TRUE then the empirical data given to the
parameter .x will be run through the tidy_empirical() function and combined
with the estimated gamma data.
Arguments
- .x
The vector of data to be passed to the function. Must be numeric.
- .auto_gen_empirical
This is a boolean value of TRUE/FALSE with default set to TRUE. This will automatically create the
tidy_empirical()output for the.xparameter and use thetidy_combine_distributions(). The user can then plot out the data using$combined_data_tblfrom the function output.
See also
Other Parameter Estimation:
util_bernoulli_param_estimate(),
util_beta_param_estimate(),
util_binomial_param_estimate(),
util_burr_param_estimate(),
util_cauchy_param_estimate(),
util_chisquare_param_estimate(),
util_exponential_param_estimate(),
util_f_param_estimate(),
util_generalized_beta_param_estimate(),
util_generalized_pareto_param_estimate(),
util_geometric_param_estimate(),
util_hypergeometric_param_estimate(),
util_inverse_burr_param_estimate(),
util_inverse_pareto_param_estimate(),
util_inverse_weibull_param_estimate(),
util_logistic_param_estimate(),
util_lognormal_param_estimate(),
util_negative_binomial_param_estimate(),
util_normal_param_estimate(),
util_paralogistic_param_estimate(),
util_pareto1_param_estimate(),
util_pareto_param_estimate(),
util_poisson_param_estimate(),
util_t_param_estimate(),
util_triangular_param_estimate(),
util_uniform_param_estimate(),
util_weibull_param_estimate(),
util_zero_truncated_binomial_param_estimate(),
util_zero_truncated_geometric_param_estimate(),
util_zero_truncated_negative_binomial_param_estimate(),
util_zero_truncated_poisson_param_estimate()
Other Gamma:
tidy_gamma(),
tidy_inverse_gamma(),
util_gamma_stats_tbl()
Examples
library(dplyr)
library(ggplot2)
tg <- tidy_gamma(.shape = 1, .scale = .3) |> pull(y)
output <- util_gamma_param_estimate(tg)
output$parameter_tbl
#> # A tibble: 3 × 10
#> dist_type samp_size min max mean variance method shape scale shape_ratio
#> <chr> <int> <dbl> <dbl> <dbl> <dbl> <chr> <dbl> <dbl> <dbl>
#> 1 Gamma 50 0.0153 0.968 0.279 0.235 NIST_… 1.41 0.197 7.16
#> 2 Gamma 50 0.0153 0.968 0.279 0.235 EnvSt… 1.38 0.197 7.01
#> 3 Gamma 50 0.0153 0.968 0.279 0.235 EnvSt… 1.34 0.197 6.79
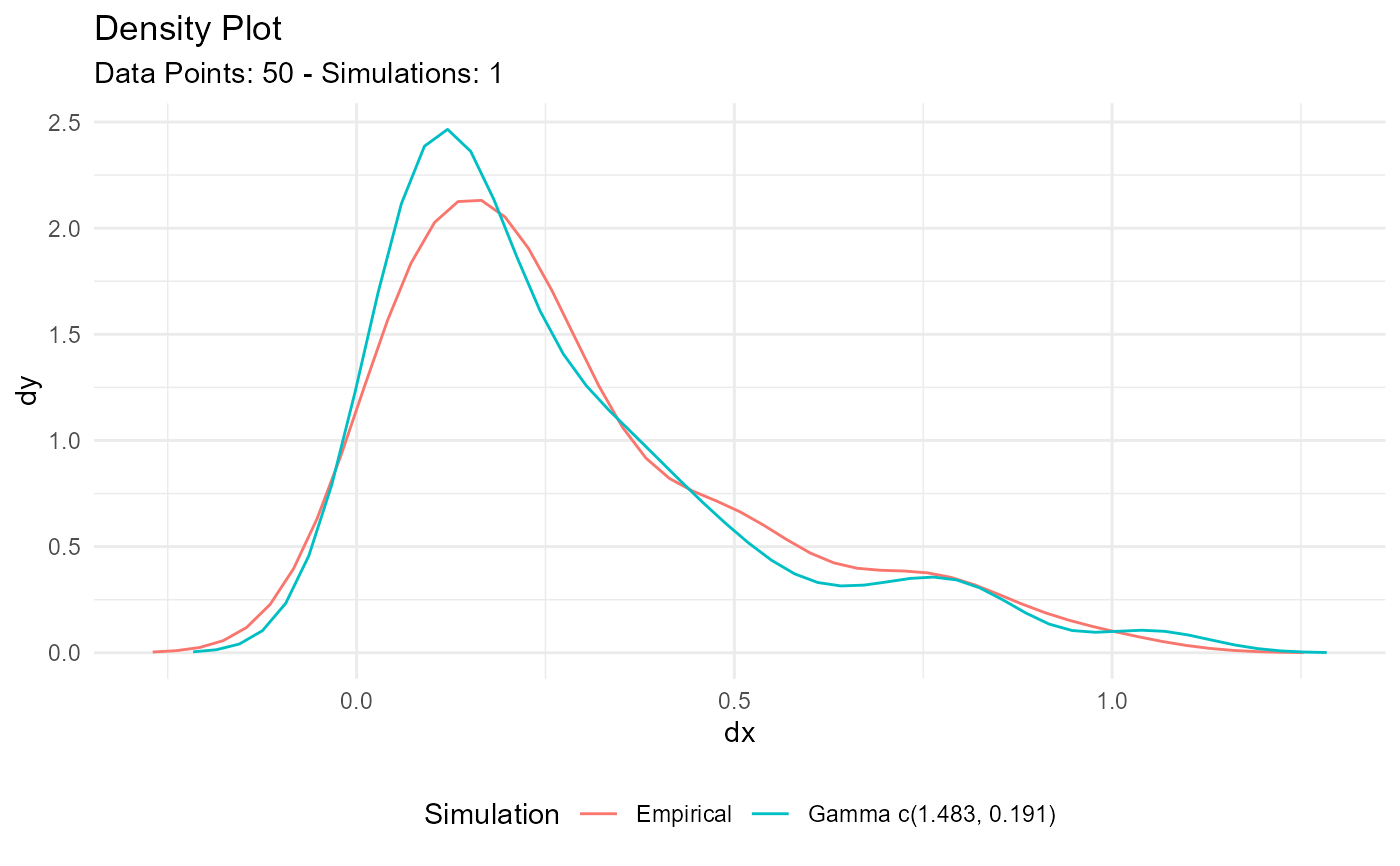
output$combined_data_tbl |>
tidy_combined_autoplot()