The function will return a list output by default, and if the parameter
.auto_gen_empirical is set to TRUE then the empirical data given to the
parameter .x will be run through the tidy_empirical() function and combined
with the estimated normal data.
Three different methods of shape parameters are supplied:
MLE/MME
MVUE
Arguments
- .x
The vector of data to be passed to the function.
- .auto_gen_empirical
This is a boolean value of TRUE/FALSE with default set to TRUE. This will automatically create the
tidy_empirical()output for the.xparameter and use thetidy_combine_distributions(). The user can then plot out the data using$combined_data_tblfrom the function output.
Details
This function will attempt to estimate the normal gaussian mean and standard deviation parameters given some vector of values.
See also
Other Parameter Estimation:
util_bernoulli_param_estimate(),
util_beta_param_estimate(),
util_binomial_param_estimate(),
util_burr_param_estimate(),
util_cauchy_param_estimate(),
util_chisquare_param_estimate(),
util_exponential_param_estimate(),
util_f_param_estimate(),
util_gamma_param_estimate(),
util_generalized_beta_param_estimate(),
util_generalized_pareto_param_estimate(),
util_geometric_param_estimate(),
util_hypergeometric_param_estimate(),
util_inverse_burr_param_estimate(),
util_inverse_pareto_param_estimate(),
util_inverse_weibull_param_estimate(),
util_logistic_param_estimate(),
util_lognormal_param_estimate(),
util_negative_binomial_param_estimate(),
util_paralogistic_param_estimate(),
util_pareto1_param_estimate(),
util_pareto_param_estimate(),
util_poisson_param_estimate(),
util_t_param_estimate(),
util_triangular_param_estimate(),
util_uniform_param_estimate(),
util_weibull_param_estimate(),
util_zero_truncated_binomial_param_estimate(),
util_zero_truncated_geometric_param_estimate(),
util_zero_truncated_negative_binomial_param_estimate(),
util_zero_truncated_poisson_param_estimate()
Other Gaussian:
tidy_inverse_normal(),
tidy_normal(),
util_normal_stats_tbl()
Examples
library(dplyr)
library(ggplot2)
x <- mtcars$mpg
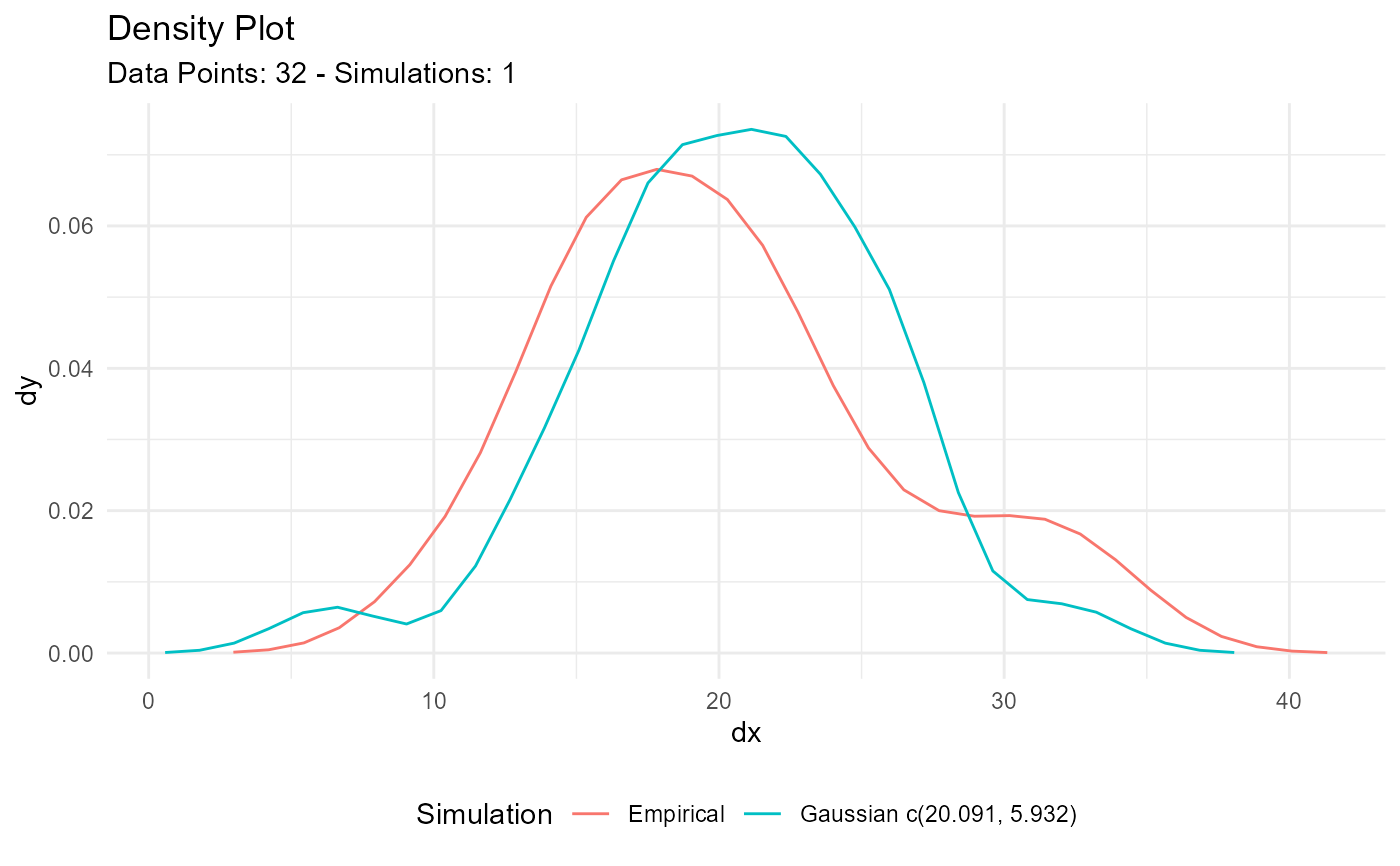
output <- util_normal_param_estimate(x)
output$parameter_tbl
#> # A tibble: 2 × 8
#> dist_type samp_size min max method mu stan_dev shape_ratio
#> <chr> <int> <dbl> <dbl> <chr> <dbl> <dbl> <dbl>
#> 1 Gaussian 32 10.4 33.9 EnvStats_MME_MLE 20.1 5.93 3.39
#> 2 Gaussian 32 10.4 33.9 EnvStats_MVUE 20.1 6.03 3.33
output$combined_data_tbl |>
tidy_combined_autoplot()
 t <- rnorm(50, 0, 1)
util_normal_param_estimate(t)$parameter_tbl
#> # A tibble: 2 × 8
#> dist_type samp_size min max method mu stan_dev shape_ratio
#> <chr> <int> <dbl> <dbl> <chr> <dbl> <dbl> <dbl>
#> 1 Gaussian 50 -2.05 2.19 EnvStats_MME_MLE -0.130 0.973 -0.133
#> 2 Gaussian 50 -2.05 2.19 EnvStats_MVUE -0.130 0.983 -0.132
t <- rnorm(50, 0, 1)
util_normal_param_estimate(t)$parameter_tbl
#> # A tibble: 2 × 8
#> dist_type samp_size min max method mu stan_dev shape_ratio
#> <chr> <int> <dbl> <dbl> <chr> <dbl> <dbl> <dbl>
#> 1 Gaussian 50 -2.05 2.19 EnvStats_MME_MLE -0.130 0.973 -0.133
#> 2 Gaussian 50 -2.05 2.19 EnvStats_MVUE -0.130 0.983 -0.132