This function will automatically scale the data from 0 to 1 if
it is not already. This means you can pass a vector like mtcars$mpg and not
worry about it.
The function will return a list output by default, and if the parameter
.auto_gen_empirical is set to TRUE then the empirical data given to the
parameter .x will be run through the tidy_empirical() function and combined
with the estimated beta data.
Three different methods of shape parameters are supplied:
Bayes
NIST mme
EnvStats mme, see
EnvStats::ebeta()
Arguments
- .x
The vector of data to be passed to the function. Must be numeric, and all values must be 0 <= x <= 1
- .auto_gen_empirical
This is a boolean value of TRUE/FALSE with default set to TRUE. This will automatically create the
tidy_empirical()output for the.xparameter and use thetidy_combine_distributions(). The user can then plot out the data using$combined_data_tblfrom the function output.
Details
This function will attempt to estimate the beta shape1 and shape2 parameters given some vector of values.
See also
Other Parameter Estimation:
util_bernoulli_param_estimate(),
util_binomial_param_estimate(),
util_burr_param_estimate(),
util_cauchy_param_estimate(),
util_chisquare_param_estimate(),
util_exponential_param_estimate(),
util_f_param_estimate(),
util_gamma_param_estimate(),
util_generalized_beta_param_estimate(),
util_generalized_pareto_param_estimate(),
util_geometric_param_estimate(),
util_hypergeometric_param_estimate(),
util_inverse_burr_param_estimate(),
util_inverse_pareto_param_estimate(),
util_inverse_weibull_param_estimate(),
util_logistic_param_estimate(),
util_lognormal_param_estimate(),
util_negative_binomial_param_estimate(),
util_normal_param_estimate(),
util_paralogistic_param_estimate(),
util_pareto1_param_estimate(),
util_pareto_param_estimate(),
util_poisson_param_estimate(),
util_t_param_estimate(),
util_triangular_param_estimate(),
util_uniform_param_estimate(),
util_weibull_param_estimate(),
util_zero_truncated_binomial_param_estimate(),
util_zero_truncated_geometric_param_estimate(),
util_zero_truncated_negative_binomial_param_estimate(),
util_zero_truncated_poisson_param_estimate()
Other Beta:
tidy_beta(),
tidy_generalized_beta(),
util_beta_stats_tbl()
Examples
library(dplyr)
library(ggplot2)
x <- mtcars$mpg
output <- util_beta_param_estimate(x)
#> For the beta distribution, its mean 'mu' should be 0 < mu < 1. The data will
#> therefore be scaled to enforce this.
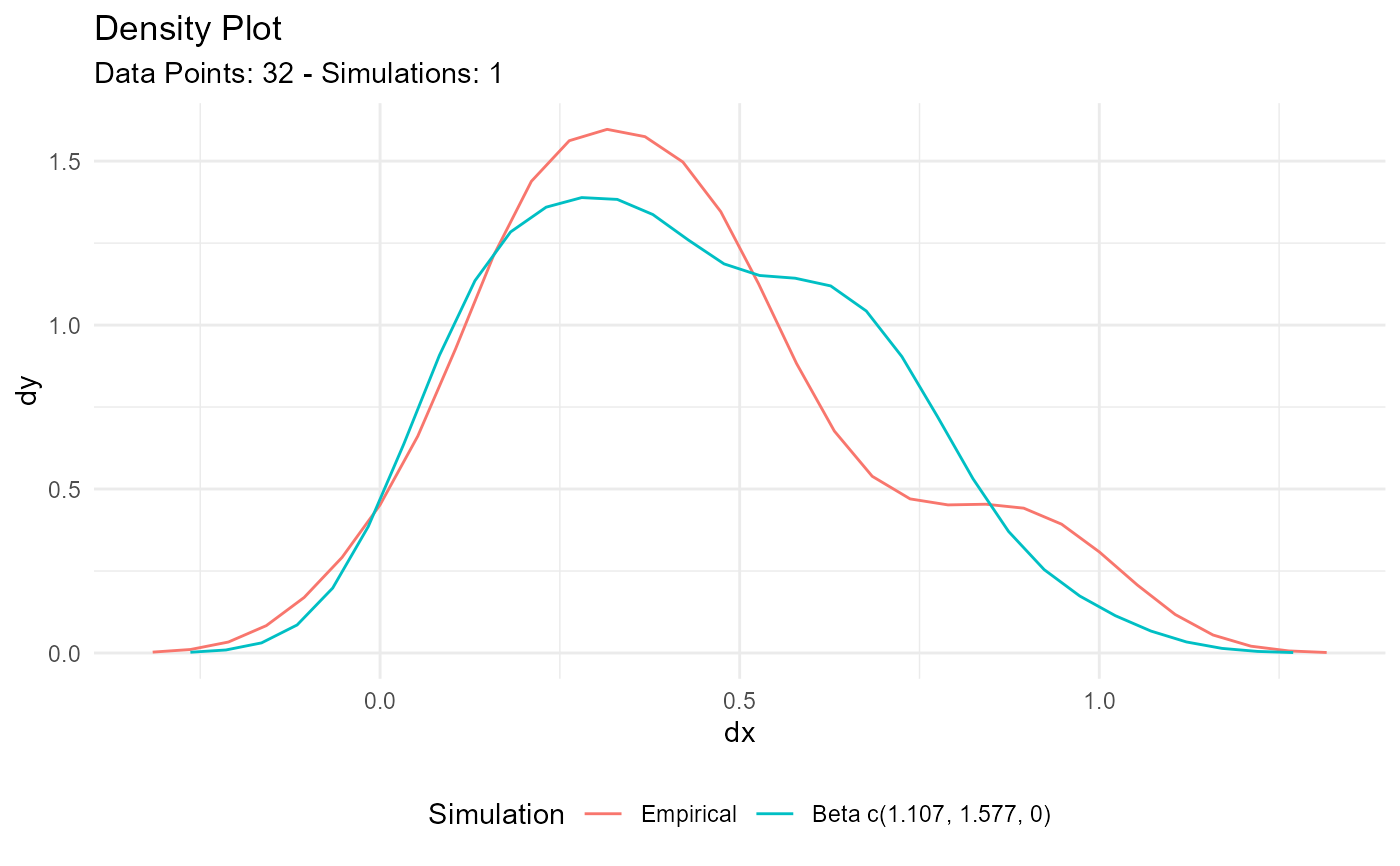
output$parameter_tbl
#> # A tibble: 3 × 10
#> dist_type samp_size min max mean variance method shape1 shape2
#> <chr> <int> <dbl> <dbl> <dbl> <dbl> <chr> <dbl> <dbl>
#> 1 Beta 32 10.4 33.9 0.412 0.0658 Bayes 13.2 18.8
#> 2 Beta 32 10.4 33.9 0.412 0.0658 NIST_MME 1.11 1.58
#> 3 Beta 32 10.4 33.9 0.412 0.0658 EnvStats_MME 1.16 1.65
#> # ℹ 1 more variable: shape_ratio <dbl>
output$combined_data_tbl |>
tidy_combined_autoplot()
 tb <- rbeta(50, 2.5, 1.4)
util_beta_param_estimate(tb)$parameter_tbl
#> There was no need to scale the data.
#> # A tibble: 3 × 10
#> dist_type samp_size min max mean variance method shape1 shape2
#> <chr> <int> <dbl> <dbl> <dbl> <dbl> <chr> <dbl> <dbl>
#> 1 Beta 50 0.101 0.956 0.627 0.0442 Bayes 31.4 18.6
#> 2 Beta 50 0.101 0.956 0.627 0.0442 NIST_MME 2.69 1.60
#> 3 Beta 50 0.101 0.956 0.627 0.0442 EnvStats_MME 2.76 1.64
#> # ℹ 1 more variable: shape_ratio <dbl>
tb <- rbeta(50, 2.5, 1.4)
util_beta_param_estimate(tb)$parameter_tbl
#> There was no need to scale the data.
#> # A tibble: 3 × 10
#> dist_type samp_size min max mean variance method shape1 shape2
#> <chr> <int> <dbl> <dbl> <dbl> <dbl> <chr> <dbl> <dbl>
#> 1 Beta 50 0.101 0.956 0.627 0.0442 Bayes 31.4 18.6
#> 2 Beta 50 0.101 0.956 0.627 0.0442 NIST_MME 2.69 1.60
#> 3 Beta 50 0.101 0.956 0.627 0.0442 EnvStats_MME 2.76 1.64
#> # ℹ 1 more variable: shape_ratio <dbl>