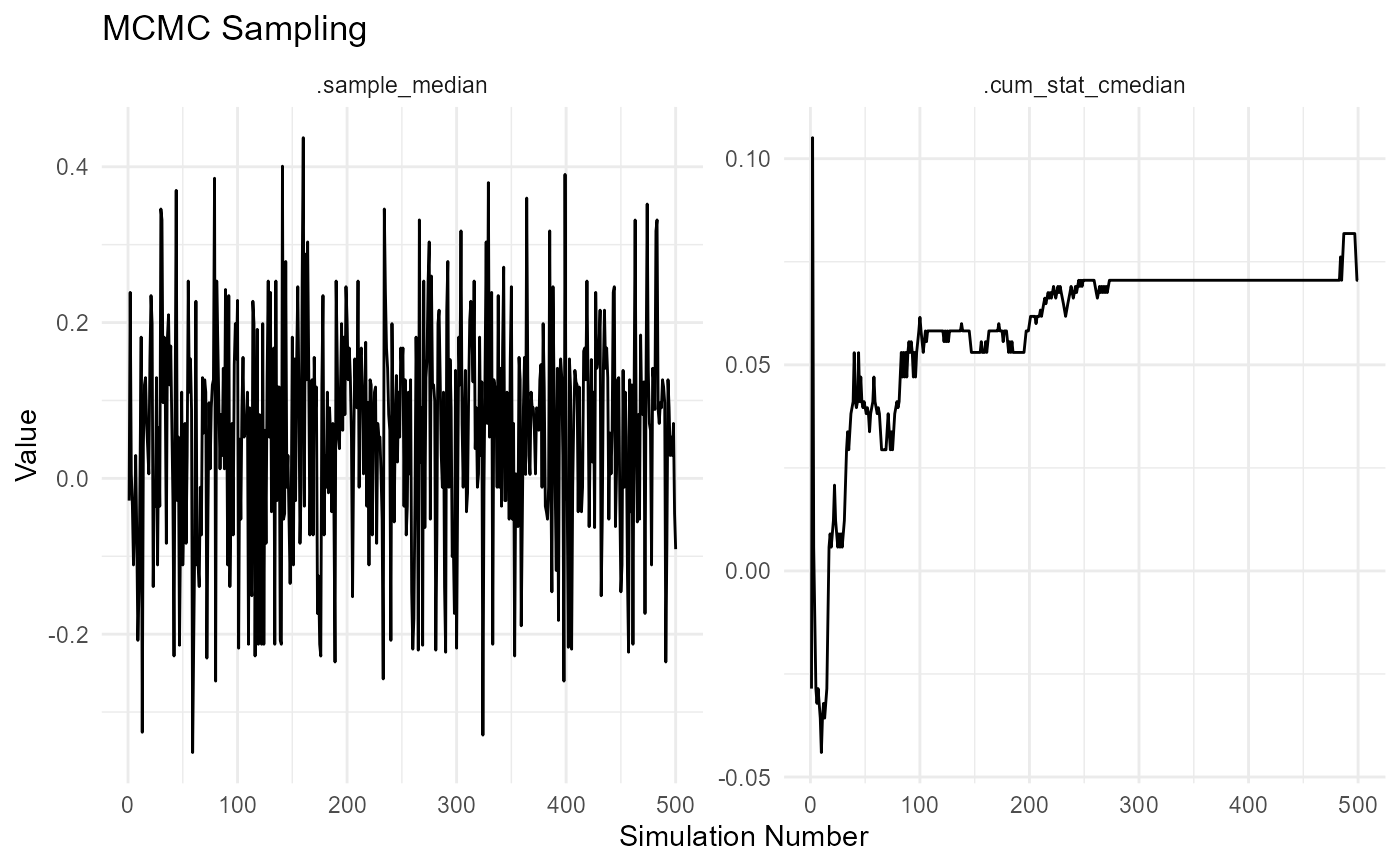
This function performs Markov Chain Monte Carlo (MCMC) sampling on the input data and returns tidy data and a plot representing the results.
Details
Perform MCMC sampling and return tidy data and a plot.
The function takes a data vector as input and performs MCMC sampling with the specified number of simulations. It applies user-defined functions to each MCMC sample and to the cumulative MCMC samples. The resulting data is formatted in a tidy format, suitable for further analysis. Additionally, a plot is generated to visualize the MCMC samples and cumulative statistics.
See also
Other Utility:
check_duplicate_rows(),
convert_to_ts(),
quantile_normalize(),
util_beta_aic(),
util_binomial_aic(),
util_cauchy_aic(),
util_chisq_aic(),
util_exponential_aic(),
util_f_aic(),
util_gamma_aic(),
util_generalized_beta_aic(),
util_generalized_pareto_aic(),
util_geometric_aic(),
util_hypergeometric_aic(),
util_inverse_burr_aic(),
util_inverse_pareto_aic(),
util_inverse_weibull_aic(),
util_logistic_aic(),
util_lognormal_aic(),
util_negative_binomial_aic(),
util_normal_aic(),
util_paralogistic_aic(),
util_pareto1_aic(),
util_pareto_aic(),
util_poisson_aic(),
util_t_aic(),
util_triangular_aic(),
util_uniform_aic(),
util_weibull_aic(),
util_zero_truncated_binomial_aic(),
util_zero_truncated_geometric_aic(),
util_zero_truncated_negative_binomial_aic(),
util_zero_truncated_poisson_aic()
Examples
# Generate MCMC samples
set.seed(123)
data <- rnorm(100)
result <- tidy_mcmc_sampling(data, "median", "cmedian", 500)
#> Warning: Setting '.num_sims' to less than 2000 means that results can be potentially
#> unstable. Consider setting to 2000 or more.
result
#> $mcmc_data
#> # A tibble: 1,000 × 3
#>    sim_number name                 value
#>    <fct>      <fct>                <dbl>
#>  1 1          .sample_median    -0.0285
#>  2 1          .cum_stat_cmedian -0.0285
#>  3 2          .sample_median     0.239
#>  4 2          .cum_stat_cmedian  0.105
#>  5 3          .sample_median     0.00576
#>  6 3          .cum_stat_cmedian  0.00576
#>  7 4          .sample_median    -0.0357
#>  8 4          .cum_stat_cmedian -0.0114
#>  9 5          .sample_median    -0.111
#> 10 5          .cum_stat_cmedian -0.0285
#> # ℹ 990 more rows
#>
#> $plt

#>
#>