Plot a Double Pendulum Trajectory
Arguments
- .data
Data returned by
double_pendulum_walk().- .walk
One walk_number label to display, rather than its position.
Value
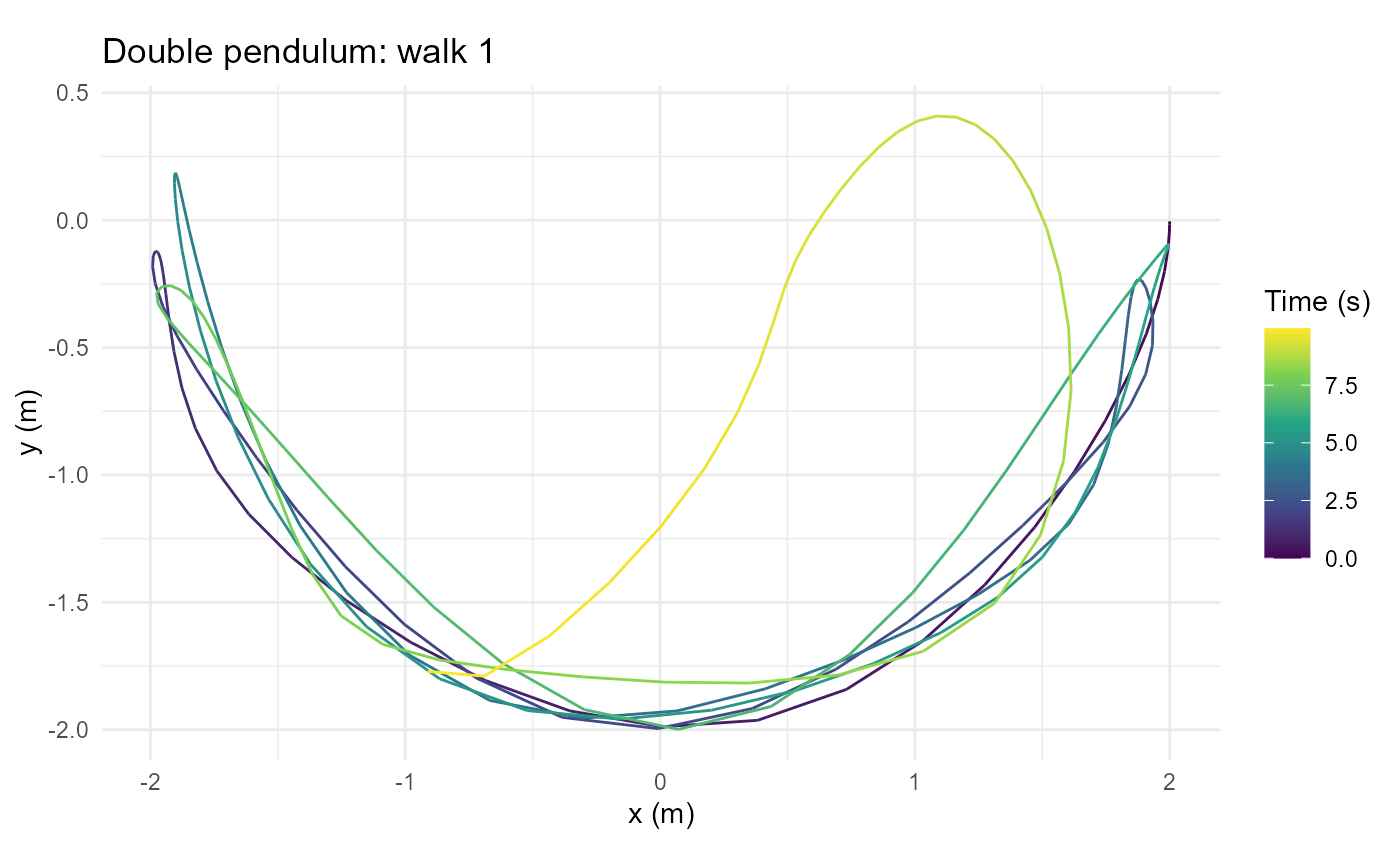
A customizable ggplot of the second bob's spatial trajectory, colored by elapsed seconds. Coordinates are in meters.
a ggplot2 object.
See also
Other Visualization Functions:
animate_double_pendulum(),
visualize_walks()
Examples
if (requireNamespace("deSolve", quietly = TRUE)) {
  plot_double_pendulum(double_pendulum_walk(.num_walks = 1, .n = 200))
}