This is an auto plotting function that will take in a tidy_
distribution function and a few arguments, one being the plot type, which is
a quoted string of one of the following:
densityquantileprobablityqqmcmc
If the number of simulations exceeds 9 then the legend will not print. The plot subtitle is put together by the attributes of the table passed to the function.
Usage
tidy_autoplot(
  .data,
  .plot_type = "density",
  .line_size = 0.5,
  .geom_point = FALSE,
  .point_size = 1,
  .geom_rug = FALSE,
  .geom_smooth = FALSE,
  .geom_jitter = FALSE,
  .interactive = FALSE
)
Arguments
- .data
The data passed in from a tidy_
distributionfunction liketidy_normal()- .plot_type
This is a quoted string like 'density'
- .line_size
The size param ggplot
- .geom_point
A Boolean value of TREU/FALSE, FALSE is the default. TRUE will return a plot with
ggplot2::ggeom_point()- .point_size
The point size param for ggplot
- .geom_rug
A Boolean value of TRUE/FALSE, FALSE is the default. TRUE will return the use of
ggplot2::geom_rug()- .geom_smooth
A Boolean value of TRUE/FALSE, FALSE is the default. TRUE will return the use of
ggplot2::geom_smooth()Theaesparameter of group is set to FALSE. This ensures a single smoothing band returned with SE also set to FALSE. Color is set to 'black' andlinetypeis 'dashed'.- .geom_jitter
A Boolean value of TRUE/FALSE, FALSE is the default. TRUE will return the use of
ggplot2::geom_jitter()- .interactive
A Boolean value of TRUE/FALSE, FALSE is the default. TRUE will return an interactive
plotlyplot.
Examples
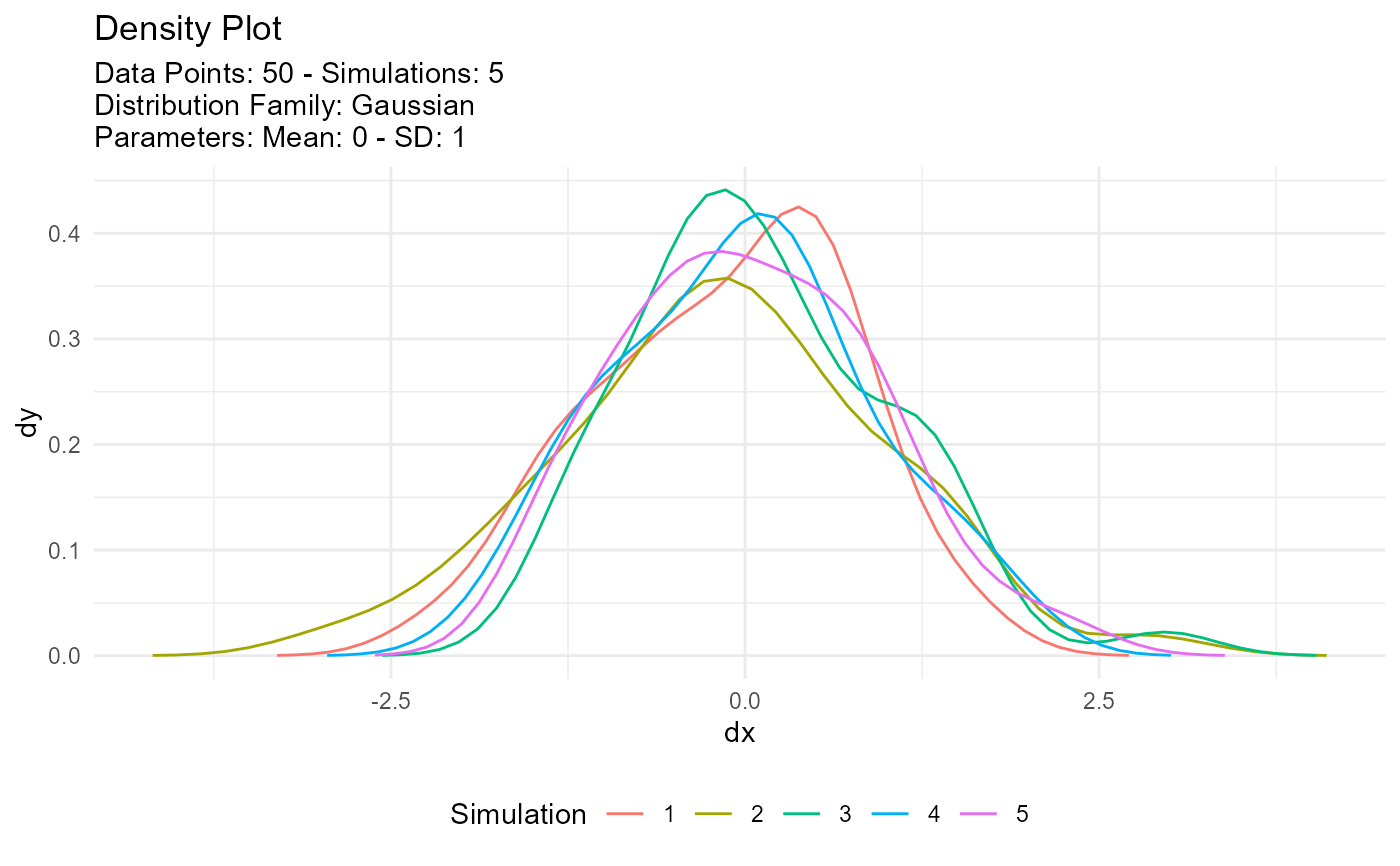
tidy_normal(.num_sims = 5) |>
tidy_autoplot()
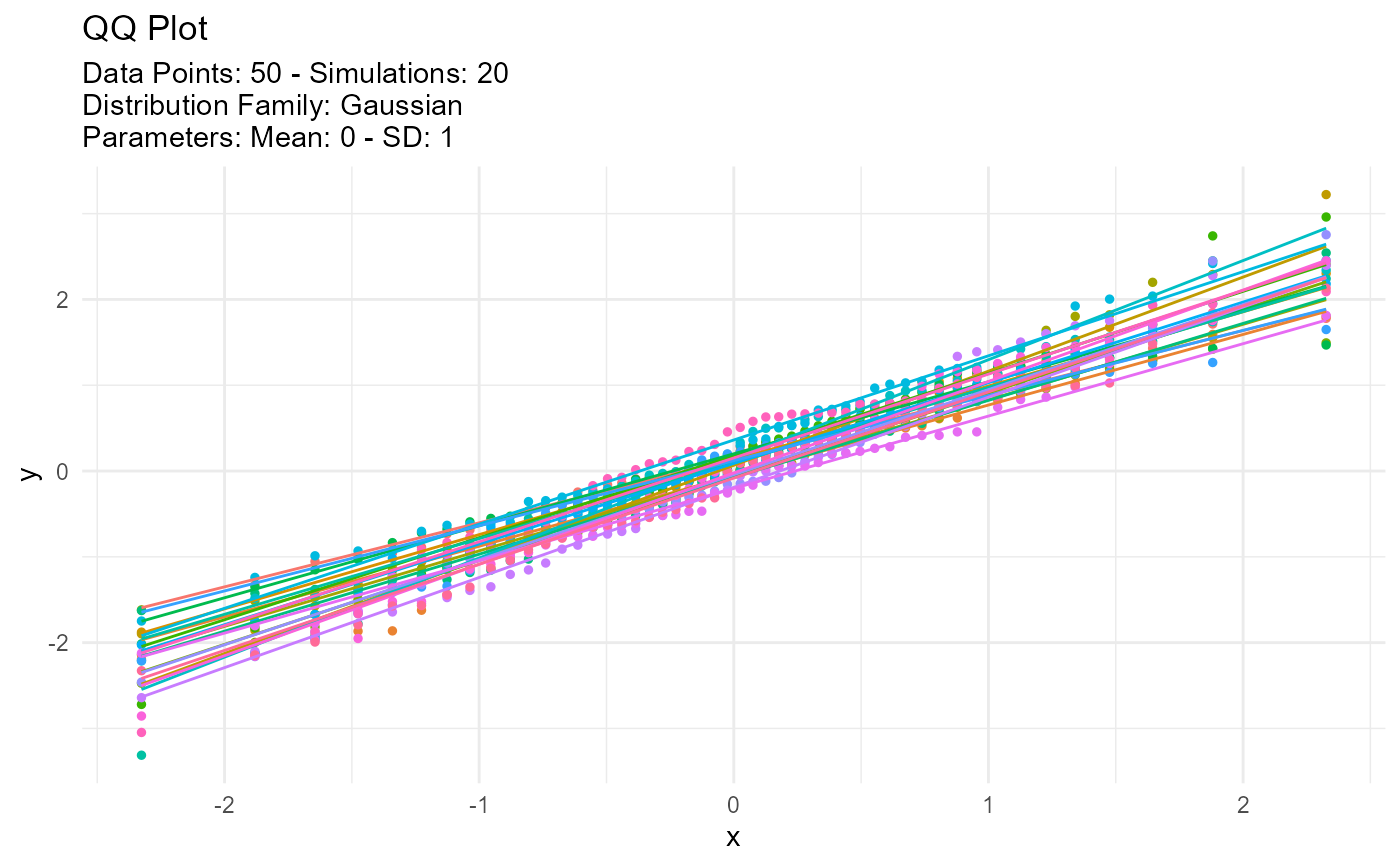
 tidy_normal(.num_sims = 20) |>
tidy_autoplot(.plot_type = "qq")
tidy_normal(.num_sims = 20) |>
tidy_autoplot(.plot_type = "qq")